Good day Hiveians!
Join me in analyzing the crypto markets!
It seems that this post aged rather well
I talked about the HIVE/BTC potential and how Hive was setting itself up for a potential massive upswing. I really suggest you have a closer look as there are many details there, but the last chart I posted was this:
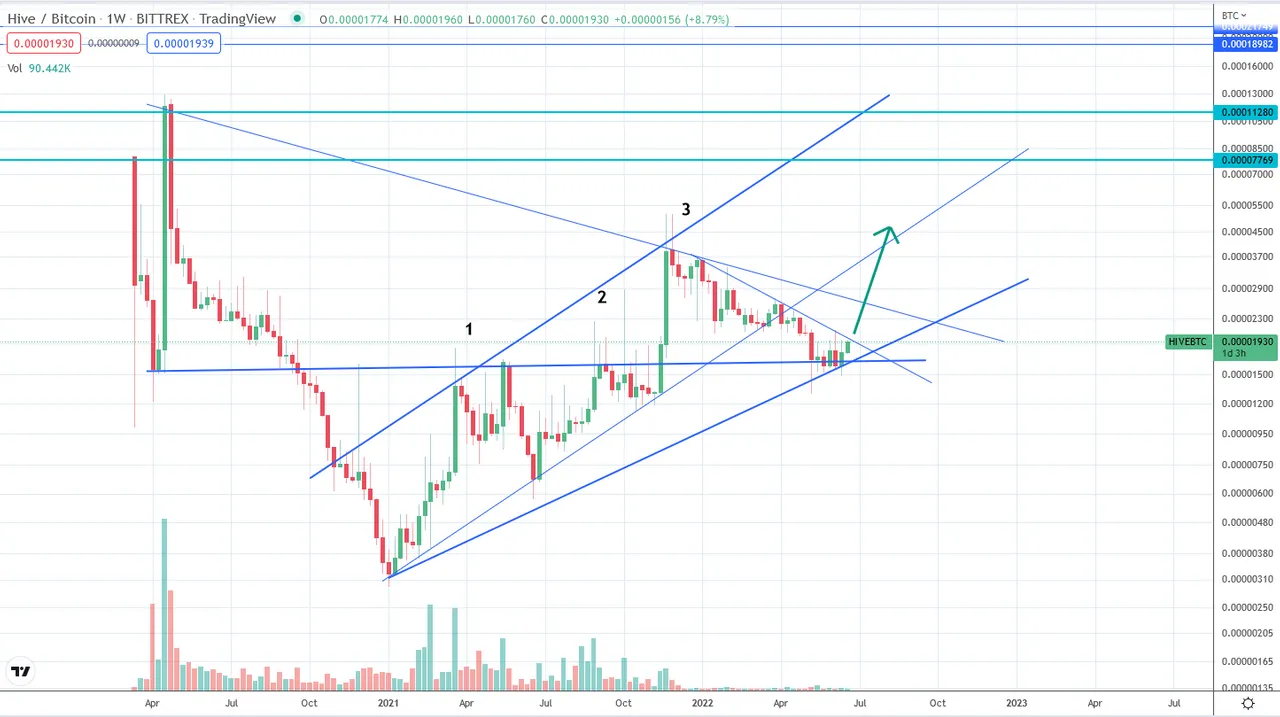
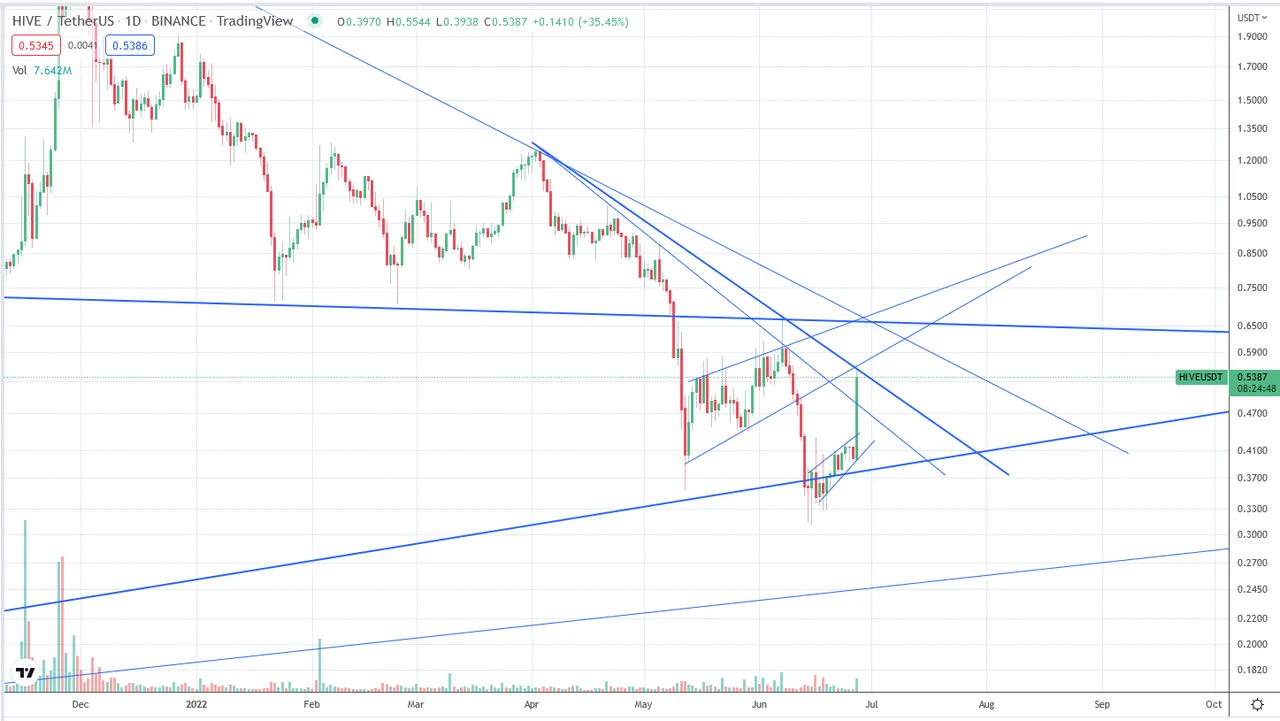
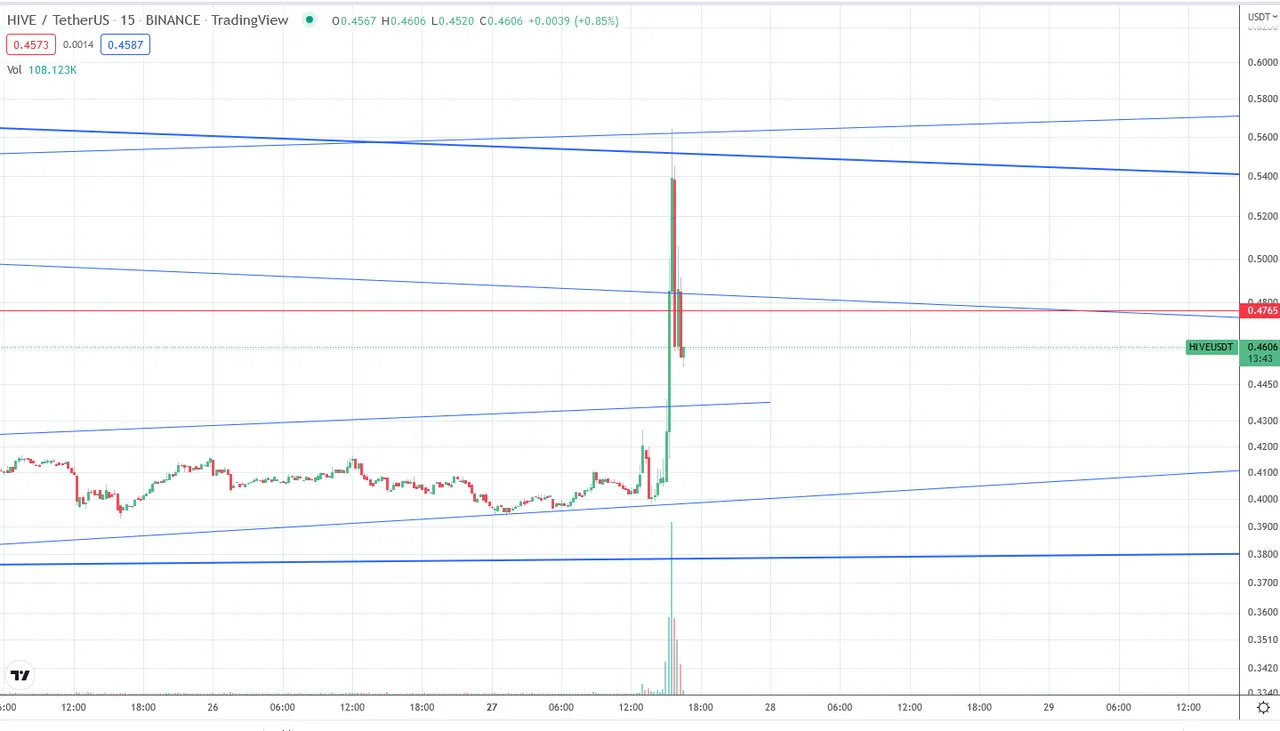
Today we got a spike to 56 cents which is a 40% gain. We know Hive does these things and we also know that these pumps tend to dump really fast as well. But the lasting effect is that Hive generally still gains upward momentum. Today's chart looks like this:
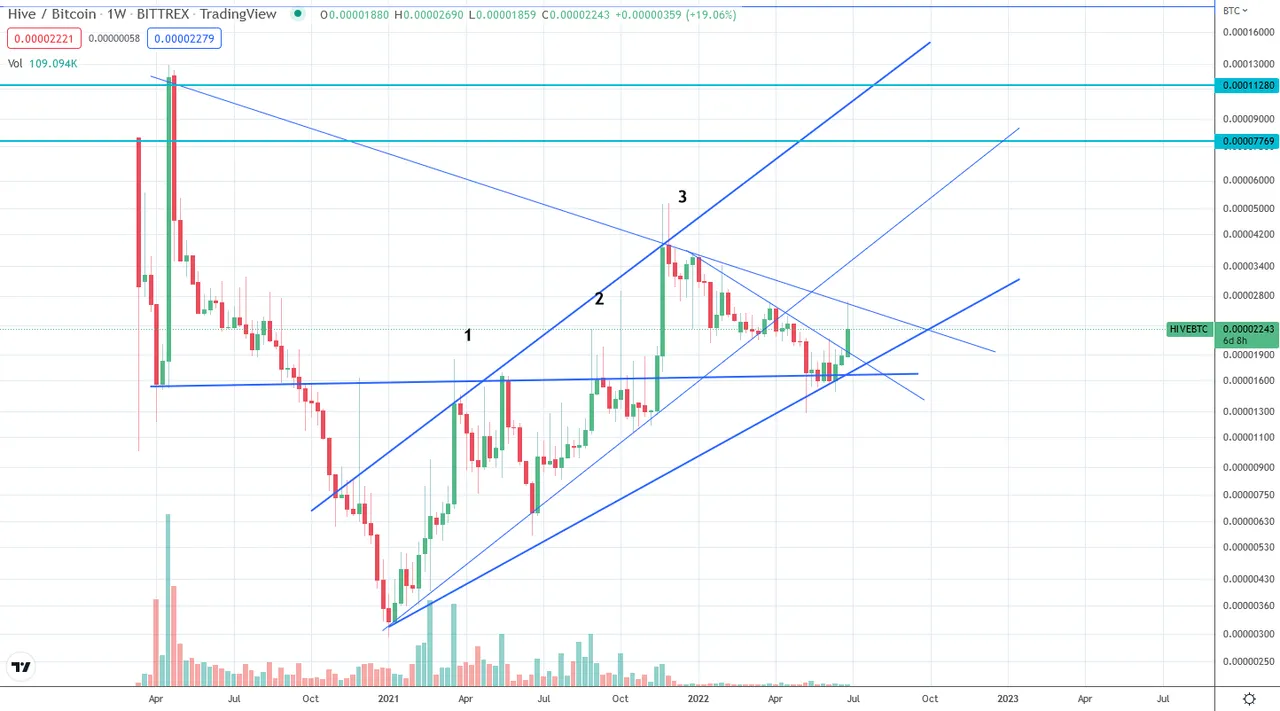
Note that it tested exactly the trend line in the chart. We all have to wait and see how sustainable this price movement will be, but as the post above suggests, it could just be the beginning!
Let's have a look in "real time" what happened today
We saw Hive leave Bitcoin and other coins behind in the dust. It's crazy when you are watching a pump like this live as it's easy to get irrational: one simply thinks the coin will moon a 100x. But that never happens, so it's important to have trend lines which often very accurately predict where things are heading. This was no exception.
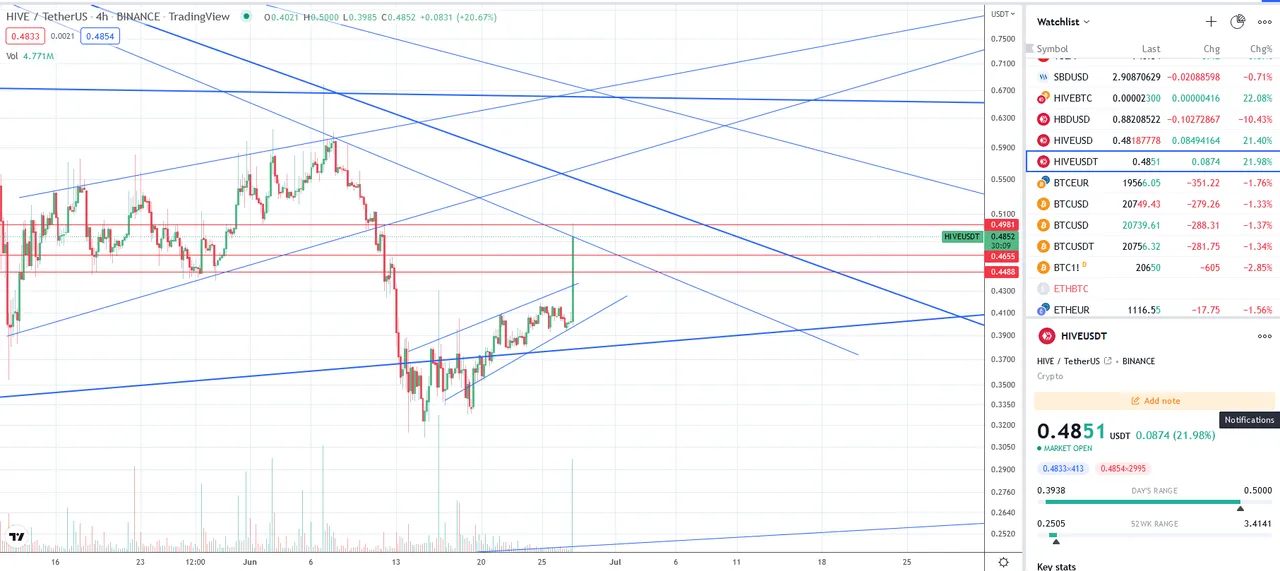
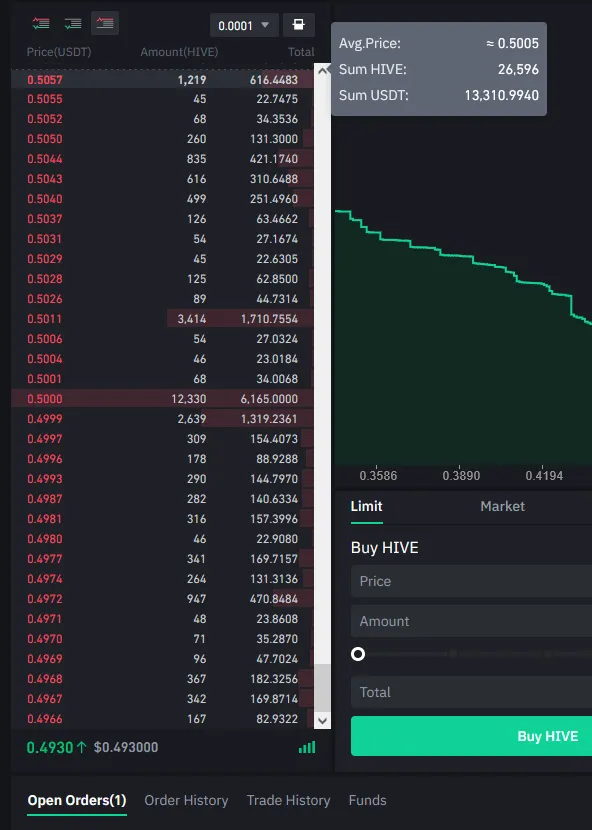
This is the trading chart (depth chart) with market orders etc. at the time of the pump when price was still heading to 56 cents. Note that the sell orders are in "retreat" shown as the line of sell orders with a relatively low inclination.
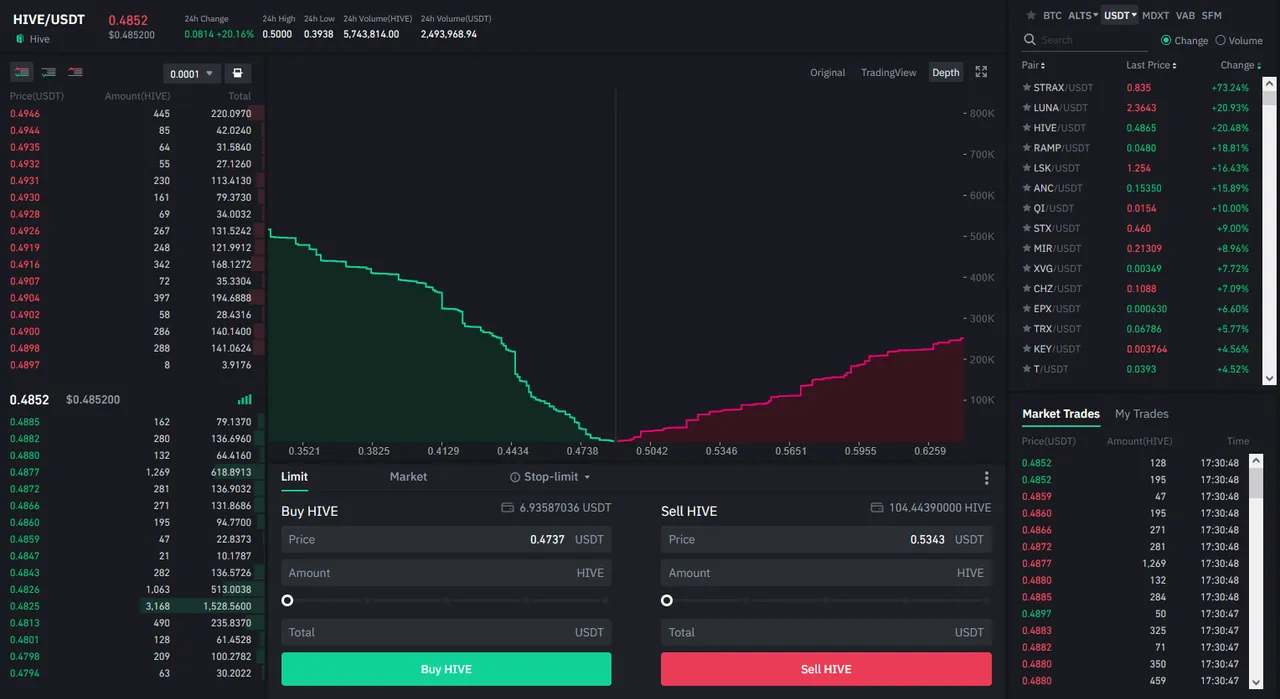
The orders were changing fast, but this is a snapshot. We had $17k buying orders (the top ones).
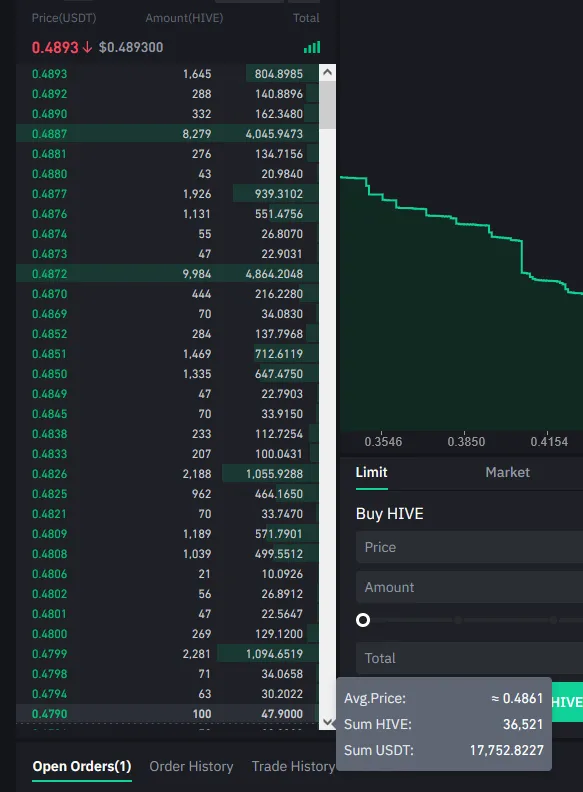
And expectantly lower selling orders at about $13k. Not that there are no real buy or sell walls. The highest one is at 10 or $20k which is nothing really which shows that Hive as most coins is easy to "manipulate". One simply can't just pump Bitcoin or Etherum like this as it has much higher volume.
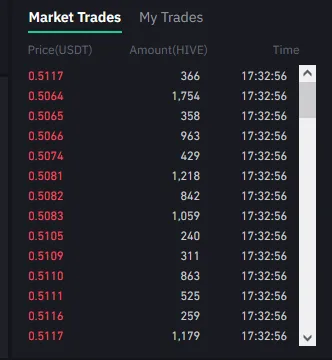
These are the real time trades
Note that when there isn't a pump going on Hive is trading with almost no volume. It can be minutes (!) without a trade. But when there is a pump or dump going on we have several trades a second (probably around 10-15 trades). As you can see the trades aren't really that spectacular in themselves; only about 300-1000 Hive per trade. But notice how the selling orders shifted the price: price moved between .5066 and 5117 in one second! This shows that there is almost no liquidity on exchanges (but Hive is no exception here).
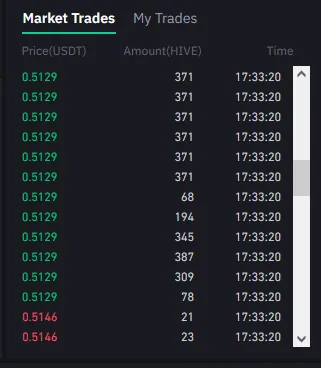
Here we have some larger individual orders between 6k and 13k.
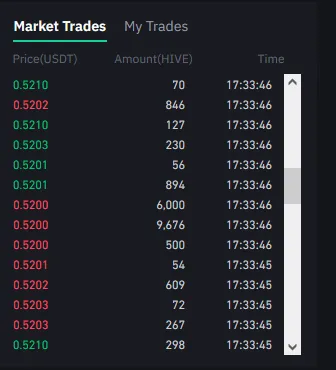
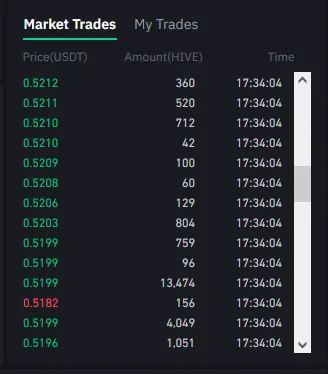
So here is where the trend lines come into play. When the candle is filled to the top like this it is easy to "panic" as one thinks there is not top. But the thick trend line was the target (I sold at 54 cents) and it was nicely filled. It also appears to be the top for now.
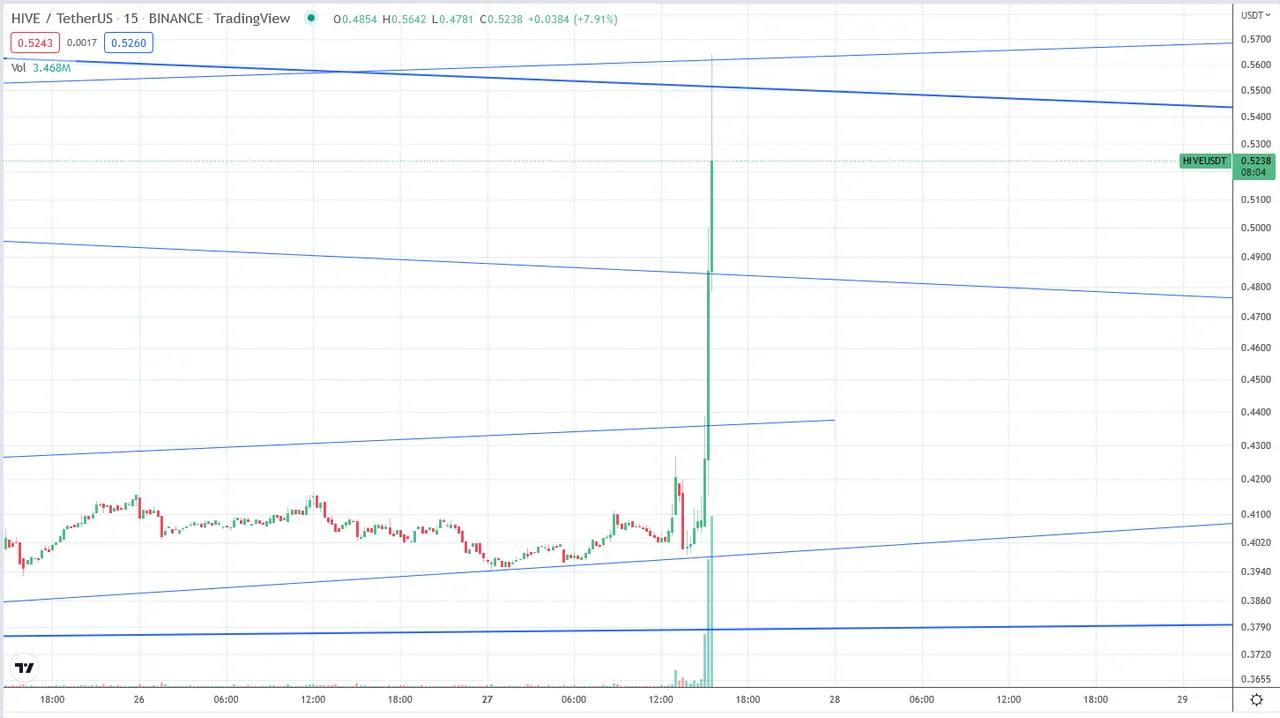
15 min chart
This is how fast it goes.a 40% rise in a matter of minutes, and then the long corrective phase lasting hours. I think there is a chance that we won't completely go to 40 cents as this was a big pump. We also crashed faster than in a normal pump; my gut feeling tells me that this could be a more sustained movement up to 50-60 cents again. But the return of this high volume (at least for short periods) is very positive in my opinion as it means that someone is still interested in Hive :)
As a general reminder: Please keep in mind that none of this is official investment advice! Crypto trading entails a great deal of risk; never spend money that you can't afford to lose!


Check out the Love The Clouds Community if you share the love for clouds!
