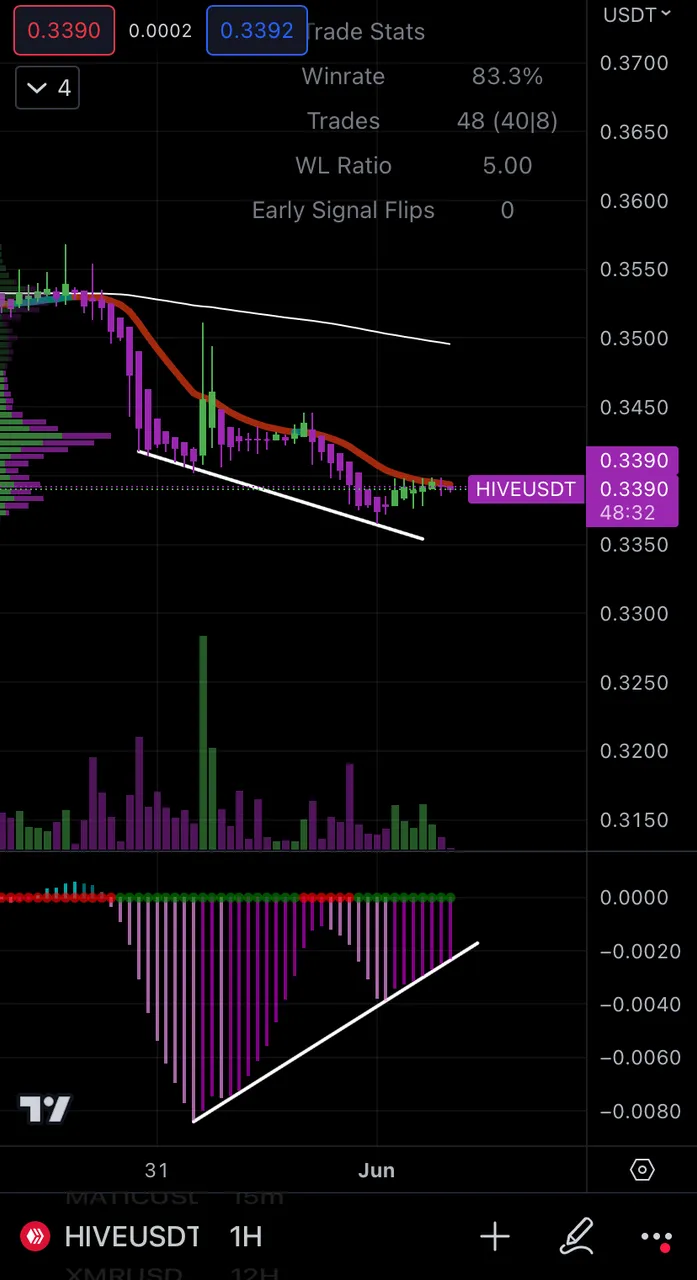
Doesn’t that Hive 1H chart just look beautiful? I am not meaning the beat down the price has gotten recently, but the rise in momentum while the price has been falling, which in trader speak is called divergence. And this is textbook bullish divergence.
What is divergence?
Divergence is trader speak for when the price action is moving one way, and the momentum indicators are moving in the opposite direction.
Bullish divergence, like what the current Hive chart is showing is when the price continues to fall and printing lower lows but the momentum indicators are showing higher lows. This eventually leads into a break to the upside, most of the time.
Bearish divergence is simply the opposite. That is when price continues to rise and making higher highs, but the momentum is slowing down and printing lower highs.
Learning Divergence Gives You Edge
As a trader, you need some sort of edge in the markets, meaning some kind of strategy that helps you win trades. Learning divergence is one of those tools to add to your toolkit to help give you that edge in the markets and make the best decision for your trades.
Until next time traders,
Be smart and trade logically!
Wanna get on a path to financial freedom?
Join the Logical Trading Academy!
https://logicaltrading.academy
Trading Education | Trade Community | Trade Alerts | Market Analysis
Disclaimer: The information in this trade journal is for educational purposes only and should not be considered financial advice. Please consult with a qualified financial advisor before making any investment decisions.