Hello, friends.
These explanations and analysis and prices are all with Iran's monetary values.

The price of Bitcoin fell sharply to $ 42,000 before the recovery process began. After that, BTC was able to recover the resistance levels of $ 43,500 and $ 45,000.
The price even crossed the 23.6% Fibonacci retracement level of the $ 52,800 downtrend to $ 42,000. The cows even raised the price above $ 46,000, but found near the active level of $ 47,450 with the active presence of sellers.
The Fibonacci correction level of 50% of the main downward movement of the $ 52,800 volatile ceiling to the $ 42,000 volatility floor has acted as a strong resistance. Also on the BTC / USD hourly chart, a major downtrend line is forming with resistance around $ 47,000.
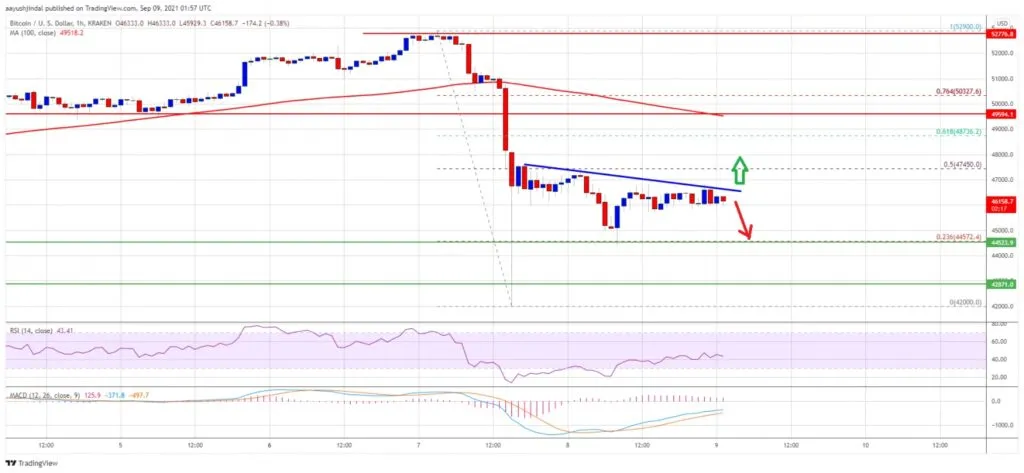
The pair is currently trading well below the $ 48,000 level ($ 46081 at the moment) and the simple 100-hour moving average. If the price rises, there will be an immediate resistance near the level of $ 47,000 against the movement of bitcoin. After that, the first major resistance is close to the $ 47,500 level. Closing the price higher than this resistance can lead to a good increase in the short term. The next big hurdle could be near the $ 48,500 area in front of the cows.
If Bitcoin fails to break the $ 47,500 resistance zone, it is likely to see a new decline. The first support in this downtrend is close to the level of $ 45,500.
The first major support is near the $ 44,800 level. If the price falls below the $ 44,800 support area, the downside trend is likely to continue. In this case, the price could re-touch the $ 43,000 support.
Technical indicators
The hourly MACD for the BTC / USD pair is slowly losing momentum in the uptrend zone.
The hourly RSI for the BTC / USD pair with a downward angle is still below the 50 level.
Main support: $ 45,500 and $ 44,800
Main resistance: $ 47,000, $ 47,500 and $ 48,500