Introduction
The aim of this review is to highlight the results of a quick assessment performed on a sales dataset to identify initial insights at first glance, which will give direction for further detailed analysis. Learn more
The dataset used was gotten from Kaggle. It is a detailed documentation of sales data for an automobile dealership company, with an array of products ranging from motorcycles to cars, buses, trucks, and trains. The dataset holds detailed information on the quantity of products ordered, prices of each product, sales made, order date, status of orders that have been placed, and a lot more.
Observation
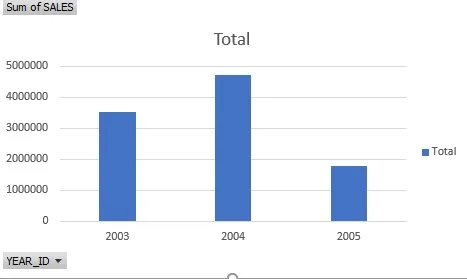
- The column "YEAR_ID" allows us to analyse sales trends over the years. Grouping the "YEAR_ID" and plotting it against the sum of sales reveals the number of sales that were received each year. The chart below clearly shows that the highest number of sales orders were received in 2004. A deeper analysis could be carried out to determine the cause.
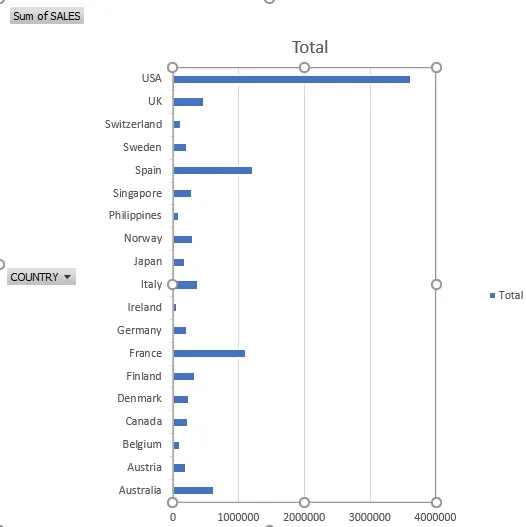
- The "country" column, when grouped, will reveal the country in which the company has received the highest number of sales orders. The visual below shows that a greater amount of sales have been made from United States of America clients. Further analysis could be carried out to determine the causative factors and enable the company to appropriately target their marketing and advertisement campaigns in the future.
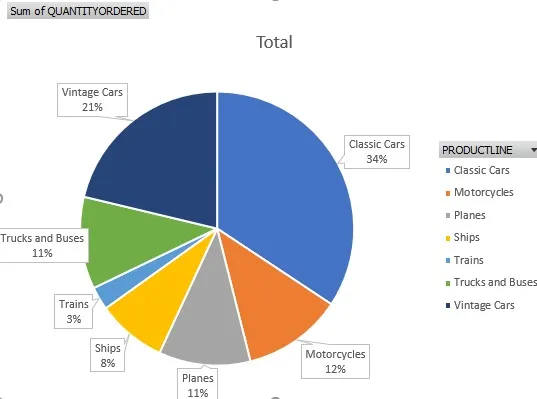
- The "PRODUCTLINE" column reveals all the products clients have ordered from the company over the years. When grouped and queried alongside the quantity ordered, the product ordered most from the company will be revealed. Hence, the company will gain insight into the product they have sold the most. This insight will help the company know the product they need to produce in larger quantities compared to others.
The inserted visual reveals that classic cars are more ordered than other products.
Conclusions
Without carrying out deep analyses, the fields in the datasets enabled us to identify sales trends over the years, the country the company has made the largest amount of sales from, and the products that have been ordered most over the years.
Suggestions for further analysis
For all the observations highlighted by a quick glance, correlation assessments between various factors, such as company location, price of products, and customer name, should be carried out to determine factors influencing the different outcomes. This will help the company make a more insightful decision.
Analysis to determine the actual sum of money made on sales should be carried out by figuring out the shipped product from the status column.
The dataset needs a shipping date column to allow the company to know how long it takes for products to be shipped. This will ensure that shipping is not delayed. Thereby enhancing the customer's satisfaction. It also needs an expenses column to carry out analysis on the profit made by the company. Click for further details