
Although Bitcoin (BTC) experienced a slight decline today after testing the $66,000 level multiple times, the recent breakout above $60,000 is significant. This move could trigger a parabolic rally due to Bitcoin's historical correlation with the Chinese Yuan (CNY).
Historical Correlation with the Yuan
Market analyst TradingShot observed that Bitcoin's price tends to rise when the Yuan strengthens against the US Dollar (USD/CNY). A post on TradingView (September 30) highlighted that similar patterns occurred in 2017 and 2020, with the current cycle closely resembling the one from 2020, which led to a significant Bitcoin rally as USD/CNY peaked.
Recent Bitcoin Price Performance
At the time of writing, Bitcoin is trading at around $64,069, marking a 2.98% decline over the last 24 hours, though signs of recovery are emerging. Analyst Ali Martinez predicts that Bitcoin could gain momentum and reach between $194,000 and $352,000 in the longer term. However, concerns remain about short-term performance, particularly as investor interest seems to be waning, as indicated by lower online search volumes, even compared to previous bear markets.
Price Forecast and Fibonacci Analysis
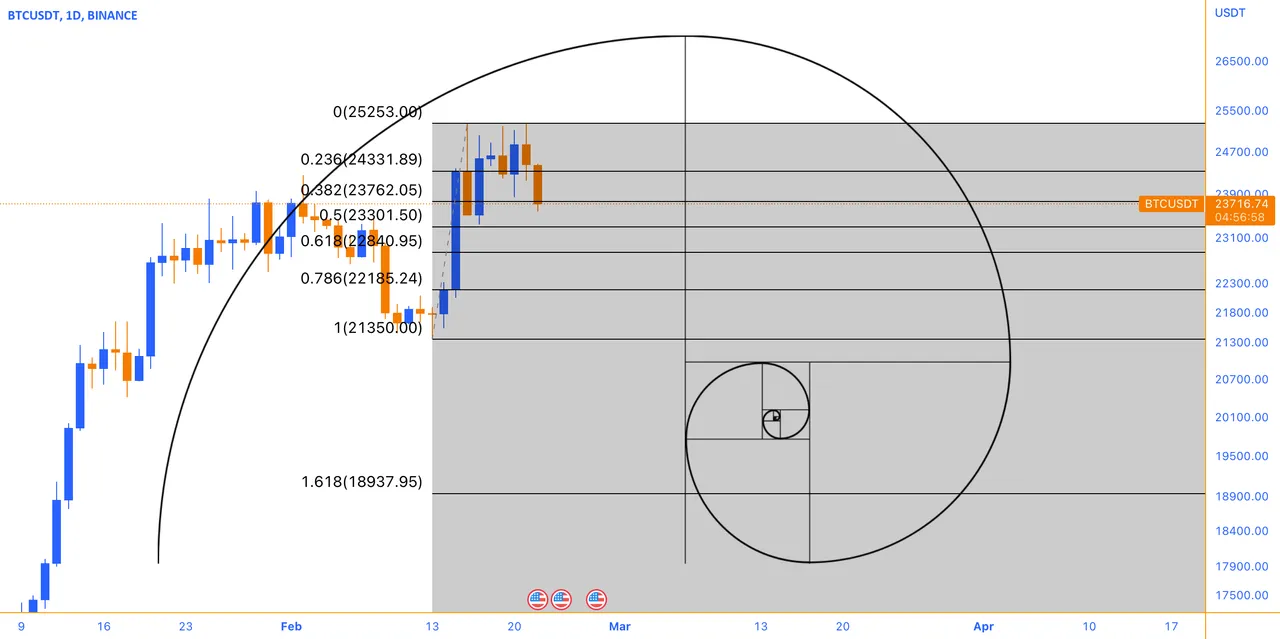
To assess potential support and resistance levels, Fibonacci retracement is applied, providing key insights:
- 0.236 Level ($65,561): A crucial first support level near the current price.
- 0.382 Level ($65,011): A lower support that could act as the second fallback.
- 0.618 Level ($64,421): Often a strong support level, historically tied to significant price rebounds.
- 1.0 Level ($62,681): This marks the start of the previous bullish move and is a critical final support if Bitcoin falls further.
Support and Resistance Zones
Bitcoin’s current price sits at $65,546, facing a resistance zone between $65,561 and $66,006. This has proven difficult to break through. A curved trendline beneath the price indicates the use of a 50-day moving average, which currently hovers near $64,300 and could offer dynamic support.
If the price touches the moving average and bounces back, this could signal a continuation of the bullish trend. However, the Relative Strength Index (RSI) is in a neutral range (around 50-55), indicating the market is neither overbought nor oversold. That said, a slight decline in RSI suggests diminishing buying pressure, hinting at the possibility of a short-term correction if the RSI continues to fall.
Bullish and Bearish Scenarios
Bullish Outlook:
If Bitcoin holds support near $65,561 (0.236 Fibonacci level) and breaks the $66,006 resistance, it could trigger further upward momentum, with the next target around $67,032—a key previous resistance level on the chart.Bearish Outlook:
If the price drops below $65,011 support, the next level to watch is $64,421 (0.618 Fibonacci level). Failure to hold this level could push Bitcoin down to $62,681, a critical support zone that might shape future trends.
Conclusion
Bitcoin's price movement remains closely tied to support from the Chinese Yuan and general market sentiment. While the current outlook suggests potential for both bullish advancement and bearish correction, much will depend on whether Bitcoin can hold key support levels or break through its current resistance. With long-term predictions as high as $352,000, investors remain cautiously optimistic despite near-term uncertainties.