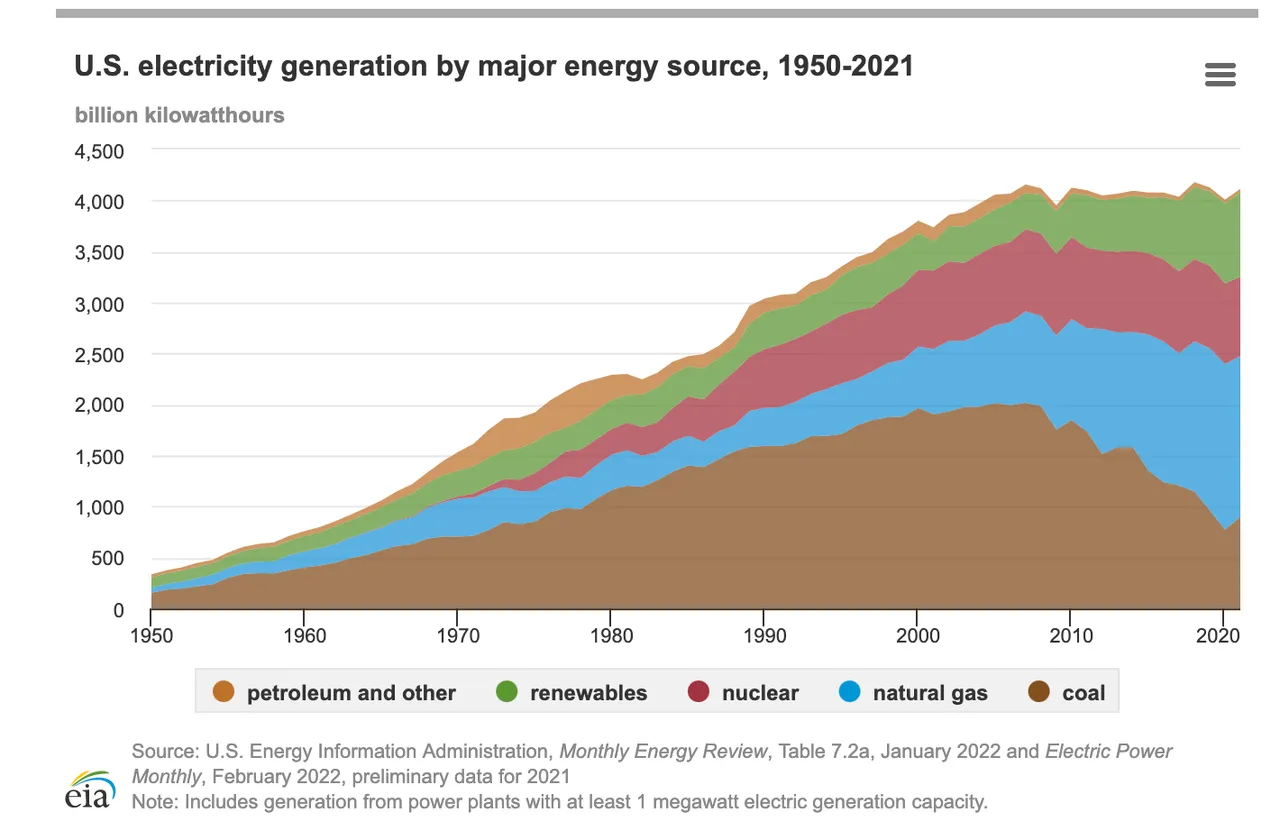
As we saw in this post, in 2020 4.0 trillion KWh of electricity were produced. In 2021 4.12 trillion KWh were produced
Natural gas went from 40% to 38%
Coal Increased from 19% to 22%
Nuclear fission decreased from 20% to 19%
Wind increased from 8.4 % to 9.2%
Hydropower decreased from 7.3% to 6.3%
Solar increased from 2.3% to 2.8%
Biomass went from 1.4% to 1.3%
Petroleum remained the same at 1.0%
Geothermal remained the same at 0.4%
Non-renewables sources of electricity were 80% and renewable 20%, just as 2020. It is interesting to see that the coal usage increased. This may mean that in a recovering economy when more energy is needed, the fastest and cheapest source of energy is the one which will be available.