ARPA Chain (Binance: ARPABNB) has broken out of the triangle pattern in the daily chart.
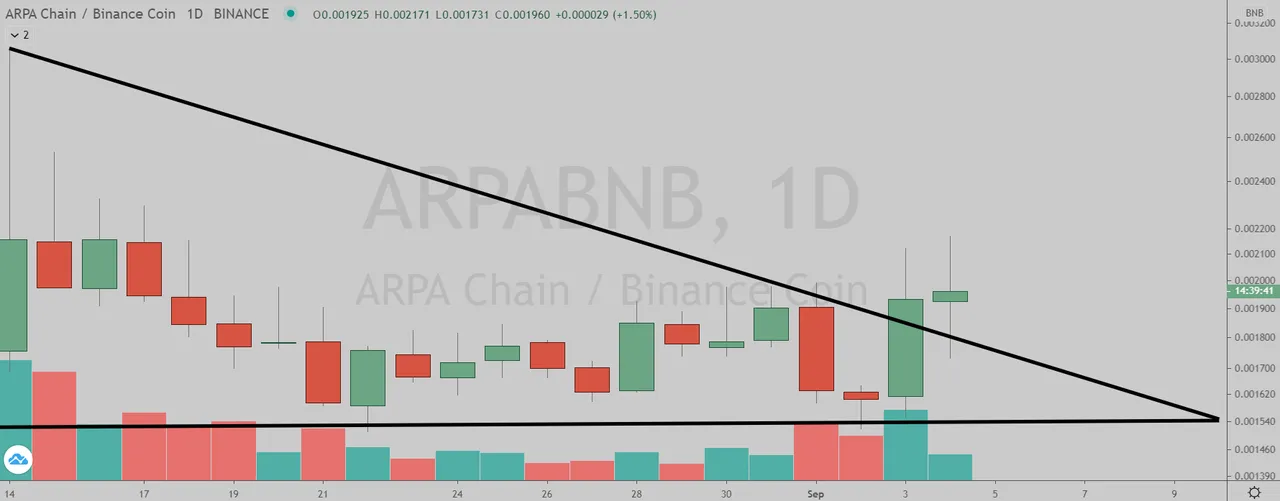
(Chart courtesy of Tradingview.com (log scale))
Elliott Wave Analysis
In Elliott Wave terms, ARPA began a red wave one advance on April 14. The red wave one ended on May 12, and the red wave two correction finished on June 1. The red wave three (blue sub-waves i-ii-iii-iv-v) finished on August 14, and the red wave four (blue sub-waves a-b-c) correction ended on September 2. If this wave count is correct, ARPA should be heading next towards the August 14 peak in the red wave five.
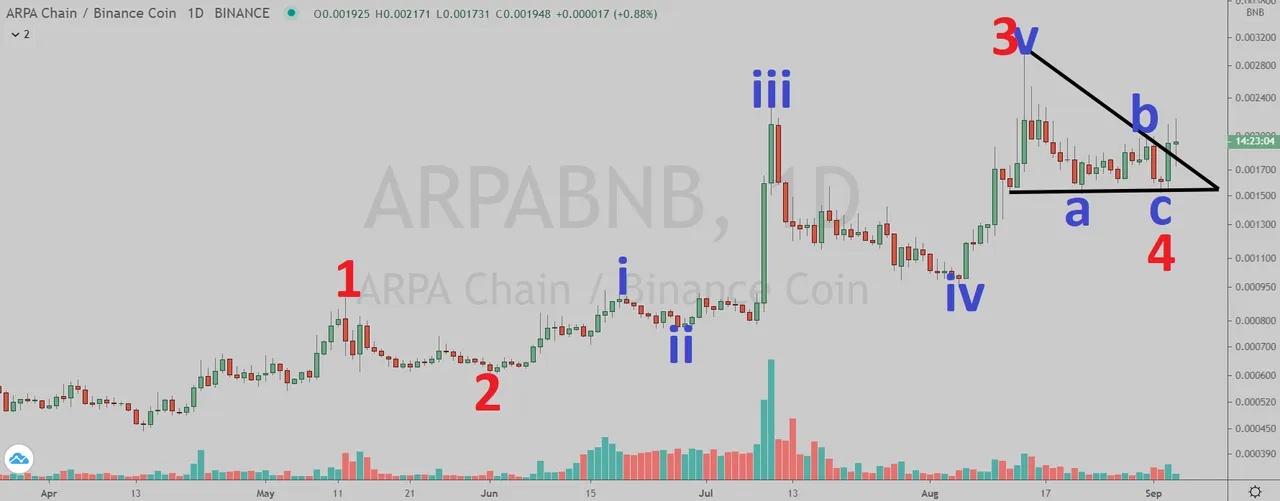
(Chart courtesy of Tradingview.com (log scale))
Funnymentals
ARPA is a privacy-preserving computation solution for blockchains and enterprises. You can read their latest monthly report here.

(Sources: https://arpachain.io/)
How Will ARPA Chain Trade?
ARPA Chain (Binance: ARPABNB) daily chart by Tradingview.
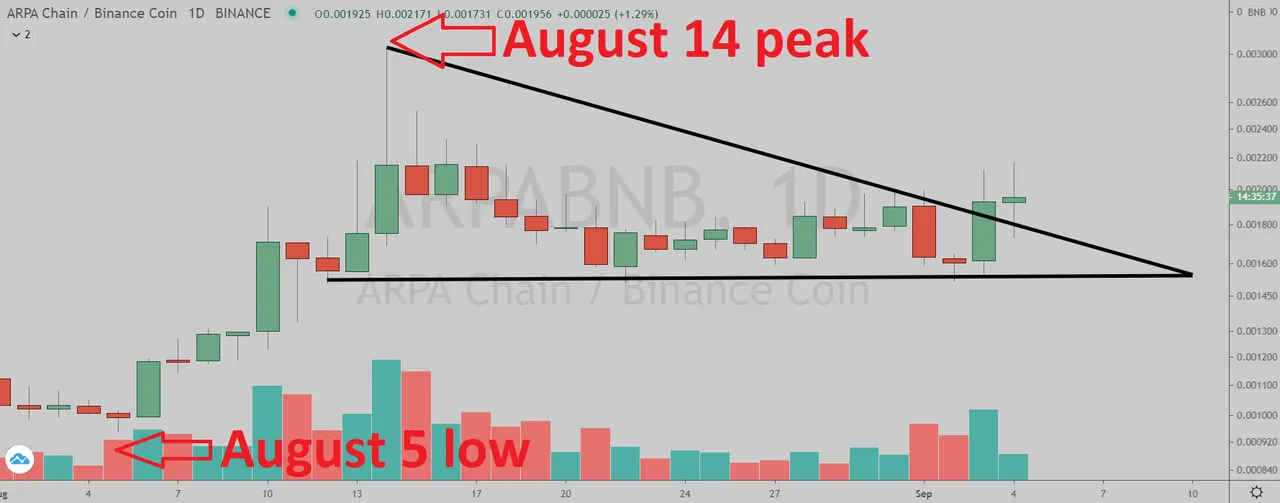
(Chart courtesy of Tradingview.com (log scale))
Prizes
I will be giving upvotes to the correct answers with minimum reputation of 25.
Rules
This poll will expire in one week. Only one vote per person.
Which one will happen first?
Please select one of the three choices and comment below.
ARPA will takeout the August 14 peak
ARPA will drop below the August 5 low
ARPA will stay in a trading range between the August 5 low and the August 14 peak until October 10