SPX6900 (Uniswap: SPXUSD) has broken out of the triangle pattern in the four-hour chart.
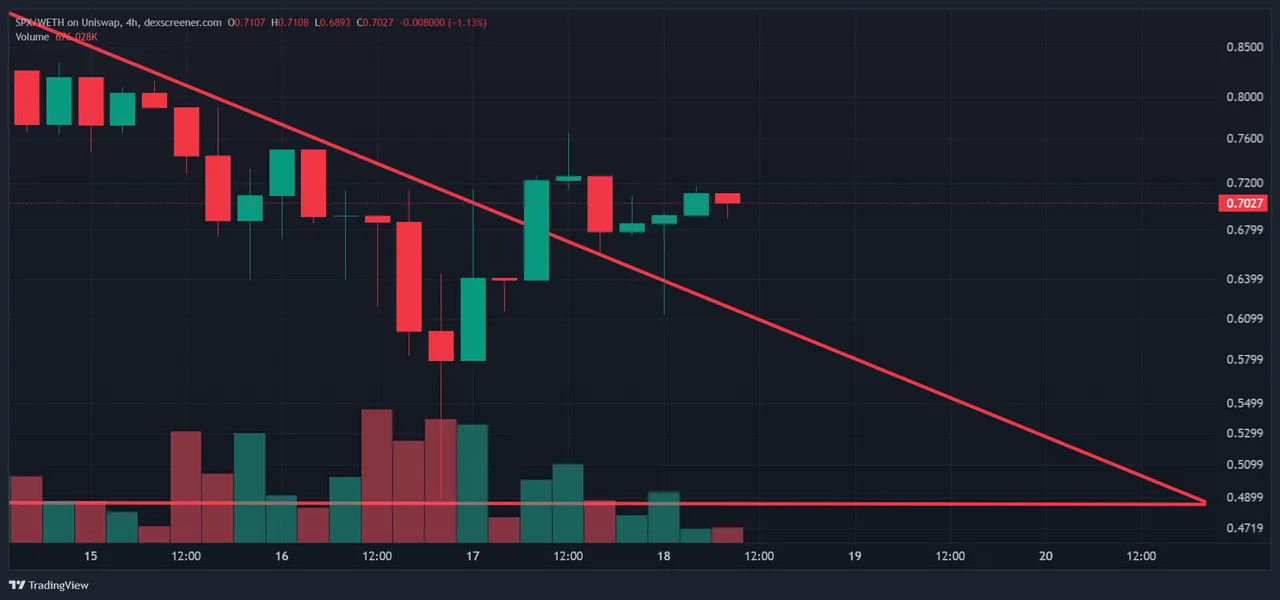
(Chart courtesy of Tradingview.com(log scale))
Elliott Wave Analysis
In Elliott Wave terms, SPX began a red wave one advance on September 25. The red wave one peaked on September 30 and the red wave two correction ended on October 1. The red wave three (blue sub-waves i-ii-iii-iv-v) finished on October 13 and the red wave four correction ended on October 16. If this wave count is correct, SPX should be heading next towards the October 13 peak in the red wave five.
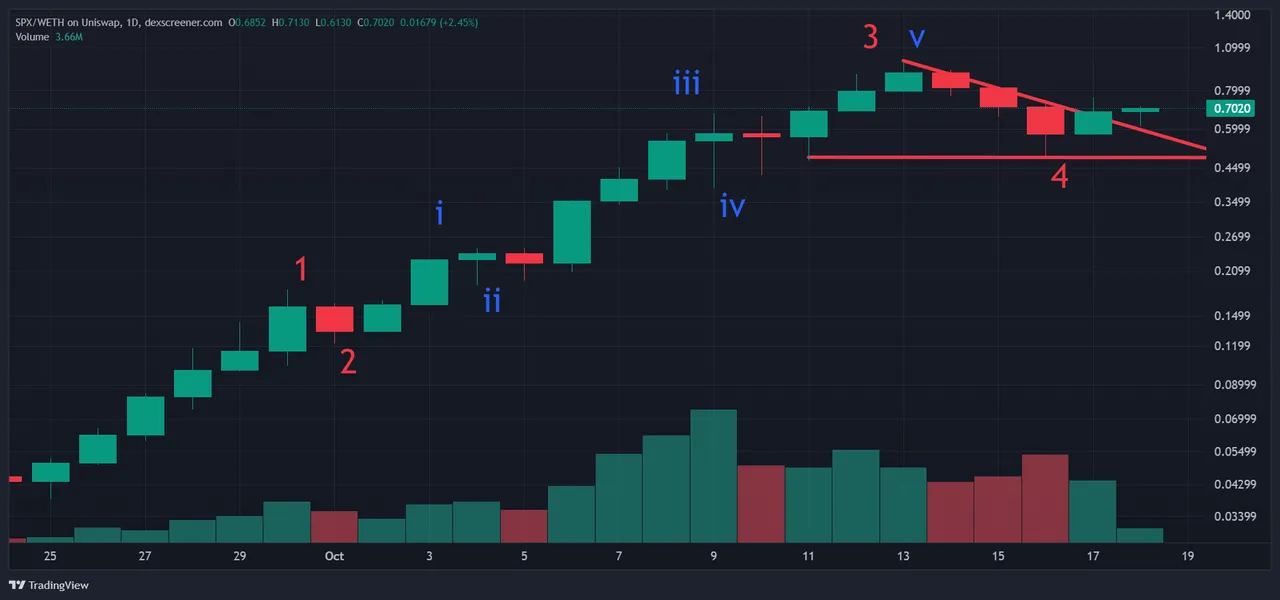
(Chart courtesy of Tradingview.com(log scale))
Funnymentals
6,900 traders storm the NYSE trading floor to proclaim that 6900 is better than 500. Across The Rubicon reviewed the project three days ago.

(Sources: https://spx6900.com/)
How Will SPX6900 Trade?
SPX6900 (Uniswap: SPXUSD) four-hour chart by Tradingview.
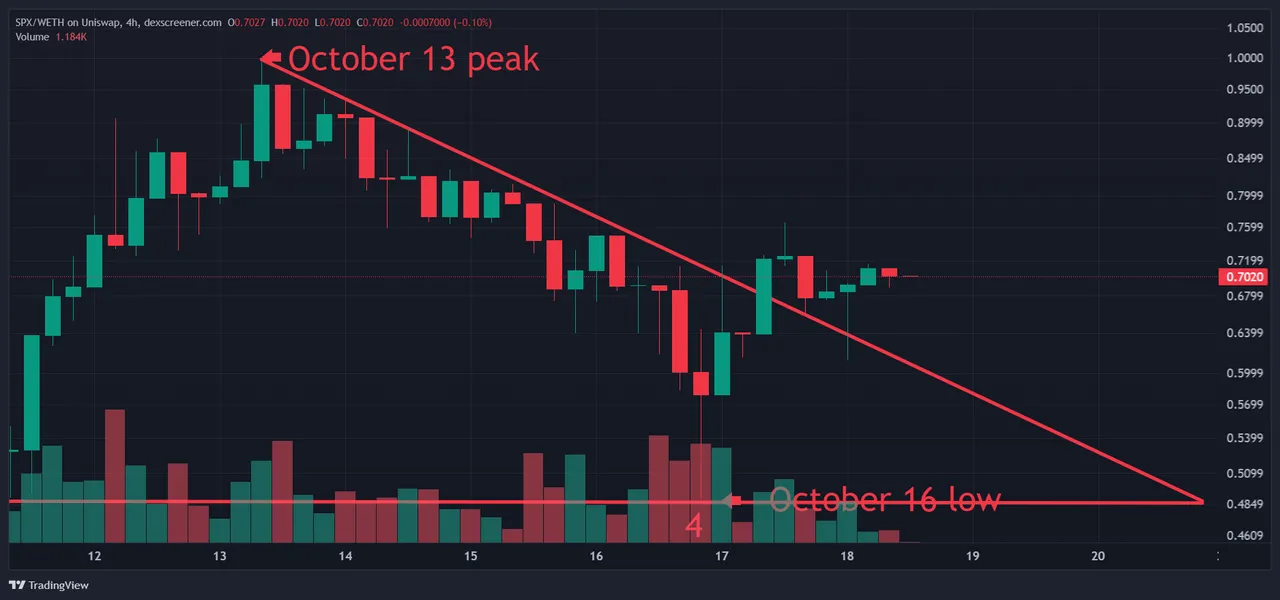
(Chart courtesy of Tradingview.com(log scale))
Prizes
I will be giving upvotes to the correct answers (posts only).
Rules
This poll will expire in one week. Only one vote per person.
Which one will happen first?
Please select one of the three choices and comment below
SPX will takeout the October 13 peak
SPX will drop below the October 16 low
SPX will stay in a trading range between the October 16 low and the October 13 peak until November 23