In the world of trading, having technical analysis tools that allow us to relate the price action with the trend is one of the most important factors when making decisions to enter or exit a given market.
Hence, in order to relate price action to the trend, it is extremely important to understand the theoretical and technical fundamentals of the indicators that help measure the speed of price action movements.

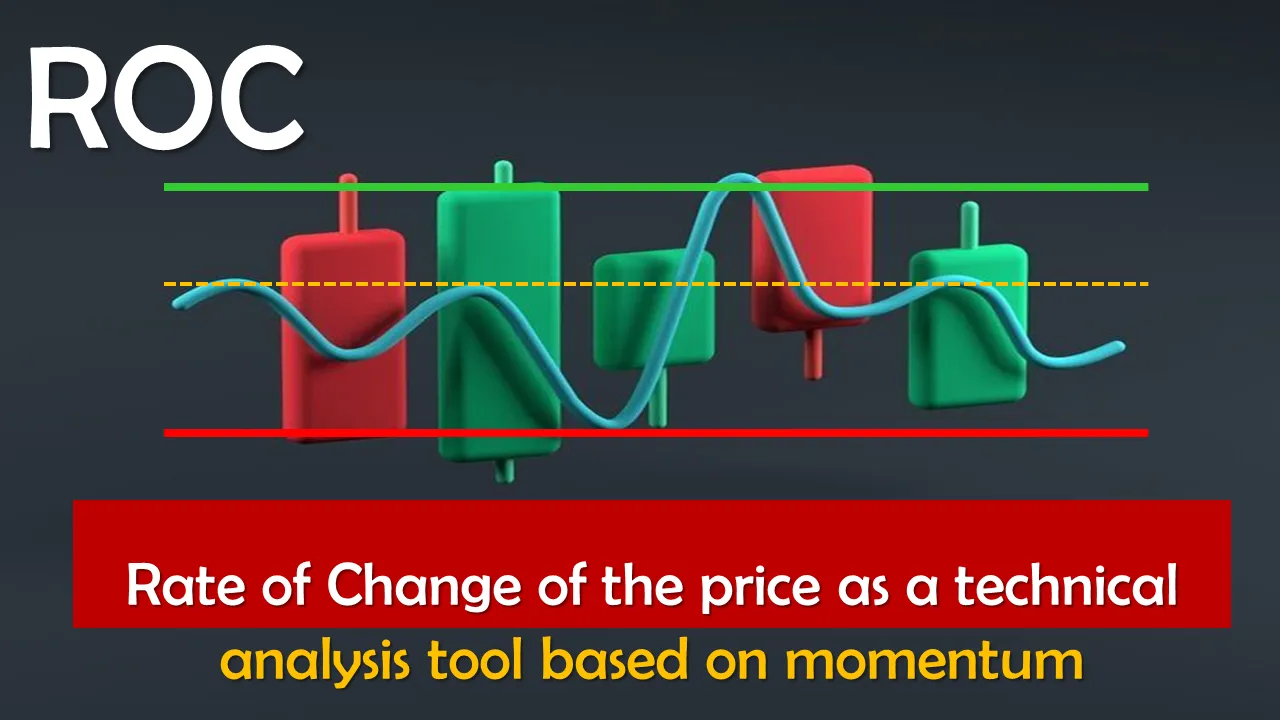
Therefore, momentum-based indicators are essential technical analysis tools that allow us to project trend strength, weakness or change, hence, in this post we will focus on socializing key aspects of the Rate of Change Indicator (ROC).
Conceptualization / Rate of Change or ROC
Before theorizing, it is important to note that the Rate of Change indicator or ROC as it is also known, is an indicator that helps determine the strength of a trend, therefore, it is considered within the category of momentum-based technical indicator.
Indeed, the Rate of Change or ROC indicator is a pure momentum oscillator that measures the percentage change in price from one period to the next, an element of vital importance in the trading world, since the charts revealed by the ROC indicator are used to project the trend.
Being a momentum indicator, the Rate of Change indicator is based on statistical data that besides helping us to determine the strength of a trend, it also prescribes technical information that serves to have an orientation on the weakness and probable change of a trend.
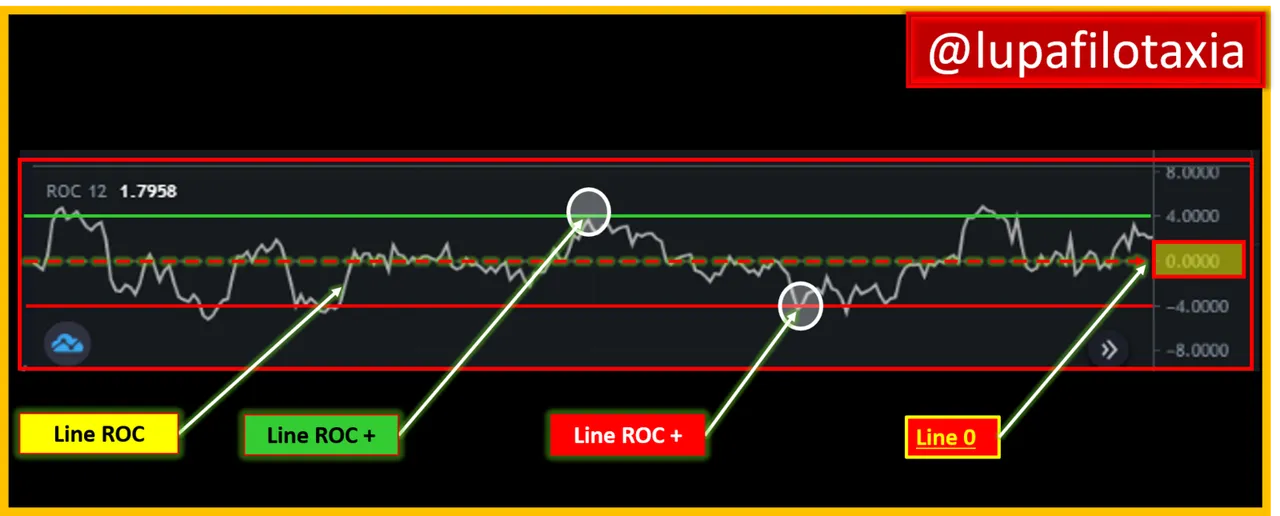
The Rate of Change indicator is represented as a number that obeys how the price has moved in the last periods, it can be a positive or negative number, therefore, it moves up and down around the zero line depending on the strength of the most recent momentum, another element to highlight is that the Rate of Change indicator tracks whether the speed of a trend is accelerating, decelerating or maintaining the same speed.
The Rate of Change indicator consists of an oscillating line called ROC line that when moving above zero (0) is called positive ROC line (+), in the opposite case if it moves below zero (0) is called negative ROC line (-), while the neutral behavior is known as zero line (0)
In the next post I will continue to expand on the technical structure of the Rate of Change indicator, namely how to calculate the value of the ROC indicator, confirmation and change of ROC.

SOURCES CONSULTED
Cory Mitchell Price Rate Of Change Indicator (ROC). Link
OBSERVATION:
The cover image was designed by the author: @lupafilotaxia, incorporating image: Coinmarketcap

