BTC Chart Published By Proanalysistrader at Tradingview
Bitcoin Chart Review
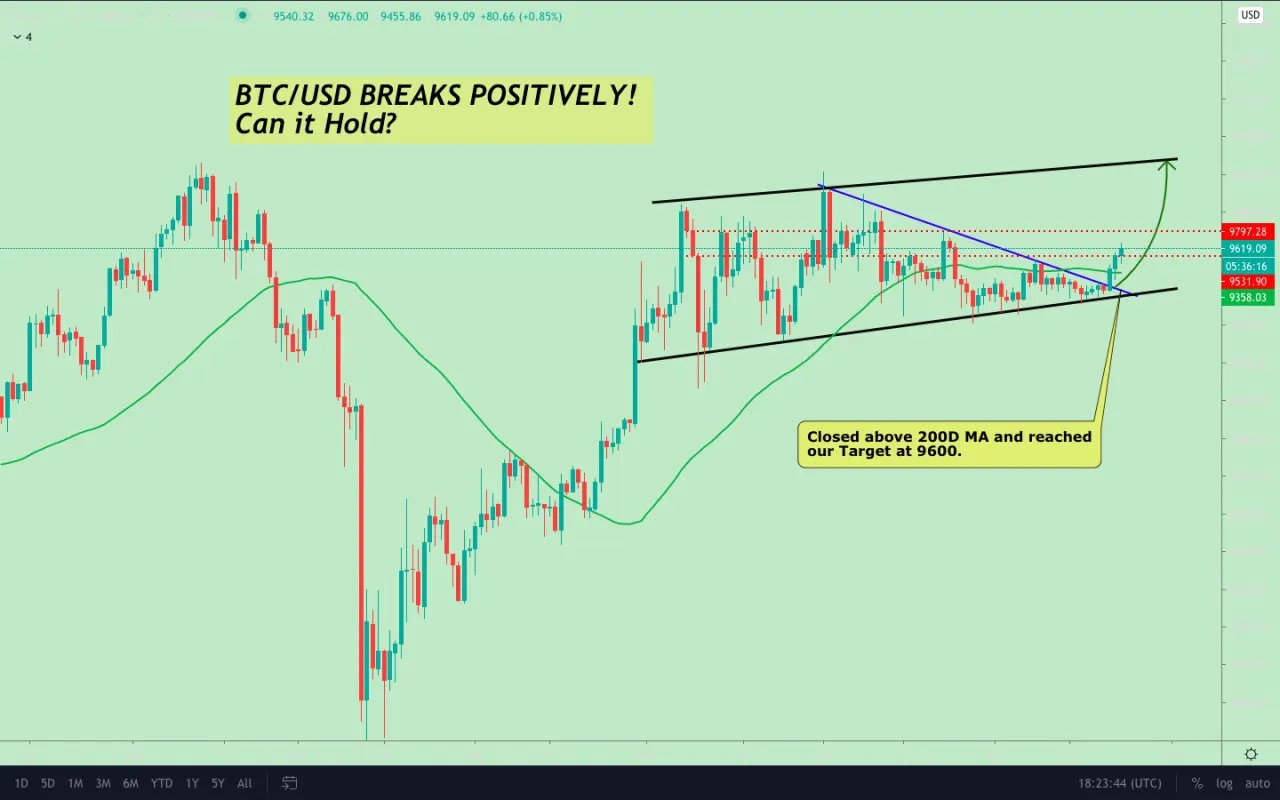
Bitcoin broke out of the triangle positively and closed above the 50D MA BTC have chosen Bullish within the next few days I am quite sure we will hit the 10k mark!
Therefore, Hope you all make some profit out of it. Bitcoin made two legs up which is more than enough.At day tf the progress is losing momentum, so be careful with USDT trades, So depending on how bullish BTC will remain, may bounce higher. Keep in mind no reversal pattern appeared on the chart yet.
https://www.tradingview.com/x/g3JBYtqa
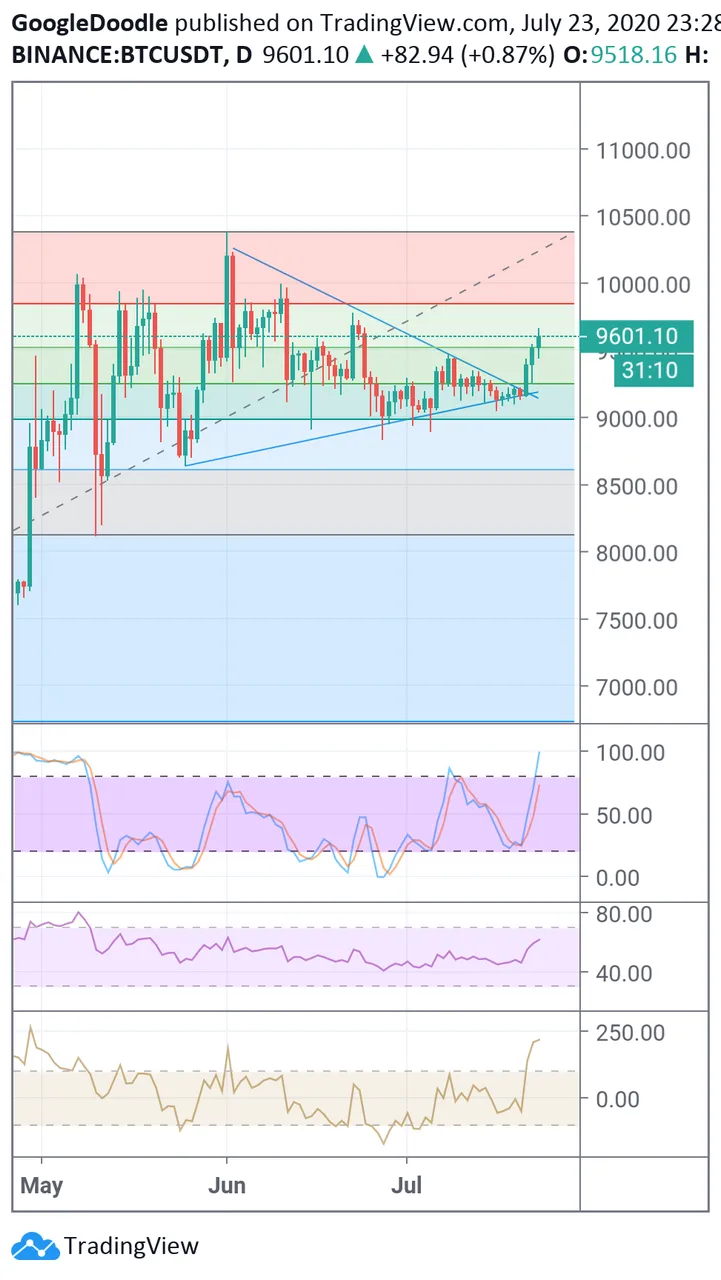
Bitcoin actually followed this chart and is moving to other resistance levels.charts are of such a level that you must have realized that by now.
From Previous Post
Personally, I'm Waiting $BTC To Approach $9600
& This is For a Reason :
We Have a "Bearish Orderblock" at $9600 Zone Along With a "Volume Gap" That is Yet To Be Filled.
If we can break above the 9700 level then we can easily hit that 10k level.
BTC is clear until new rises, Two significant resistance levels are plotted in the chart, Price should go up from this zone, An immediate correction will follow from the $ 9770 area and Bitcoin price should reach anyway above 10,200 $ - it's possible high volatility from there.
Now am waiting to see how the market will act.
4H: EMA89 at 9249 and MAVW at 9190 act as dynamic support.
R - 9750 - 10000 - 10200
S - 9500 - 9400 - 9355
- Fear & Greed index: 55 (<= 50 <= 44 <= 44 <= 41)
- BTC Dominance: 61.5% (<= 62.1 <= 62.3 <= 62)
- 24h Volume: $63 billion (<= 54 <= 53 <= 49 <= 45)
Note: This Is Not Financial Advice, Do Your Own Research💯