Moving Average Convergence/Divergence (MACD) is a vital trend-following momentum indicator used by traders to analyze the relationship between two exponential moving averages (EMAs) of an asset's price. MACD is a versatile tool that offers insights into potential buying or selling opportunities.
MACD Calculation
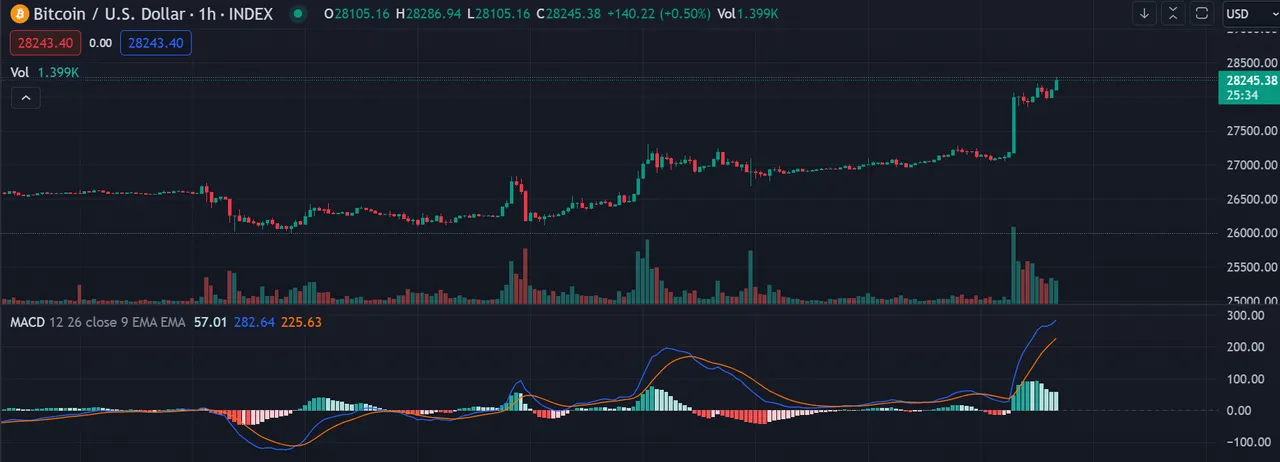
The MACD line is derived from subtracting the 26-period EMA from the 12-period EMA.
Additionally, a nine-day EMA of the MACD line is known as the signal line.
This signal line is plotted alongside the MACD line, serving as a trigger for buy or sell signals.
Using MACD for Trading Decisions
Crossovers: Traders often buy when the MACD line crosses above the signal line, signaling a potential upward price movement. Conversely, a MACD line crossing below the signal line may prompt selling or shorting decisions.
Divergences: Divergence occurs when the MACD does not align with the price trend. For instance, bullish divergence takes place when the MACD forms two rising lows while the price experiences falling lows, suggesting a potential upward reversal. Conversely, bearish divergence occurs when the MACD shows two falling highs amid rising price highs, indicating a potential downward trend.
Rapid Rises/Falls: Sudden, rapid movements in MACD, where the shorter-term moving average diverges significantly from the longer-term average, can signal overbought or oversold conditions. Traders often combine this information with other indicators, like the Relative Strength Index (RSI), for confirmation.
MACD as a Lagging Indicator
MACD is a lagging indicator because it relies on historical price data. However, traders can use the MACD histogram to anticipate future trend changes. The histogram reveals timing differences compared to the MACD itself.
Understanding MACD Divergence
MACD divergence occurs when MACD readings do not align with price movements. Positive (bullish) divergence happens when the MACD doesn't reach a new low despite falling prices, suggesting a potential upward reversal. Negative (bearish) divergence occurs when the MACD fails to reach a new high alongside rising prices, indicating a potential downward trend.
MACD is a powerful tool in a trader's arsenal. While it can offer valuable insights into potential price movements, traders should use it in conjunction with other technical indicators for confirmation. Remember that MACD is a lagging indicator, so seeking confirmation from leading indicators can help mitigate false signals and improve trading decisions.
Anticipated Impact of MACD in Trading
The MACD indicator provides traders with valuable insights into potential price movements. When used effectively, it can help traders make informed decisions about entering or exiting positions. However, it's essential to recognize that MACD is not infallible and may produce false signals.
As traders become more proficient in using MACD, they can better assess its reliability in various market conditions. Additionally, combining MACD with other technical indicators, such as RSI or ADX, can enhance its effectiveness. Traders should also consider the overall market context, news events, and fundamental analysis when making trading decisions based on MACD signals.
The impact of MACD on trading outcomes can vary depending on the trader's skill, experience, and risk management strategies. It is not a guaranteed predictor of future price movements but rather a tool to assist traders in making more informed choices. Traders should continuously refine their trading strategies and adapt to changing market conditions to maximize the benefits of MACD in their trading endeavors.