Moving Average Convergence/Divergence (MACD) is a dynamic momentum indicator that traders and investors rely on to analyze the interplay between two exponential moving averages (EMAs) applied to a security's price.
This article delves into MACD's components, its interpretation, and practical implications for traders and investors.
Key Components of MACD
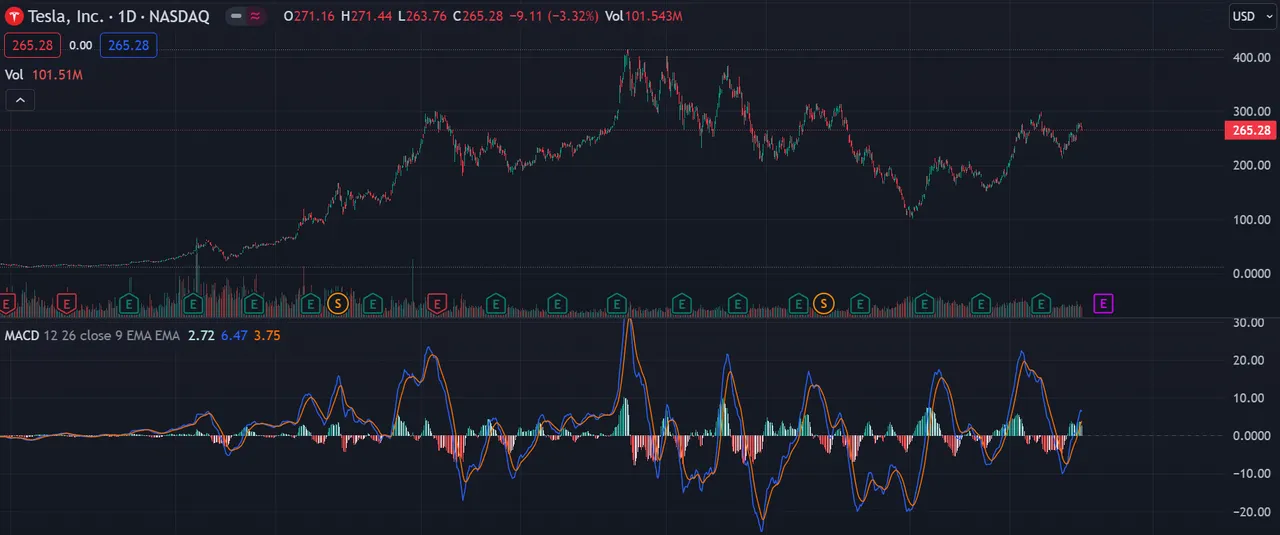
The MACD comprises two fundamental components: the MACD line and the signal line.
Deriving the MACD line involves subtracting the 26-period EMA from the 12-period EMA.
The signal line, a nine-day EMA of the MACD line, overlays the MACD line and acts as a trigger for buy and sell decisions.
Deciphering MACD
Crossovers: MACD crossovers play a pivotal role in generating actionable signals. A bullish crossover materializes when the MACD line ascends above the signal line, hinting at a potential uptrend. Conversely, a bearish crossover transpires when the MACD line descends below the signal line, signaling a potential downtrend.
Divergences: MACD excels at detecting divergences between price movements and momentum. For instance, if a security's price attains a new high while MACD fails to follow suit, this divergence may signify an impending trend reversal.
Swift Changes in Momentum: Rapid and substantial changes in MACD values can indicate significant momentum shifts, unveiling enticing trading opportunities.
Real-World Applications of MACD
Overbought and Oversold Signals: MACD aids in identifying whether a security is overbought (when MACD significantly surpasses its baseline) or oversold (when MACD significantly lags below its baseline). These conditions offer insights into trend robustness and potential reversals.
Confirmation of Trends: MACD serves as a dependable trend confirmation tool. A positive MACD divergence suggests that the two EMAs are diverging, indicating a robust trend. Conversely, a negative divergence signifies a fading trend.
Histogram: MACD is typically accompanied by a histogram, serving as a visual representation of the gap between MACD and its signal line. An above-baseline histogram denotes bullish momentum, while a below-baseline histogram indicates bearish momentum.
The MACD Formula
MACD = 12-Period EMA - 26-Period EMA
MACD computation involves subtracting the 26-period EMA from the 12-period EMA. EMAs emphasize recent data points, rendering MACD more responsive to recent price shifts than simple moving averages (SMAs).
Learning from MACD
MACD assumes a positive value when the 12-period EMA surpasses the 26-period EMA and turns negative when the 12-period EMA lags behind the 26-period EMA.
The gap between MACD and its baseline reflects the widening or narrowing of the chasm between the two EMAs.
The MACD histogram is a valuable tool for assessing the intensity of bullish or bearish momentum.
MACD is a versatile instrument for traders and investors seeking insights into trends, momentum, and potential trend reversals in financial markets. A firm grasp of its components and how to decipher its signals equips market participants with the means to make well-informed trading decisions.