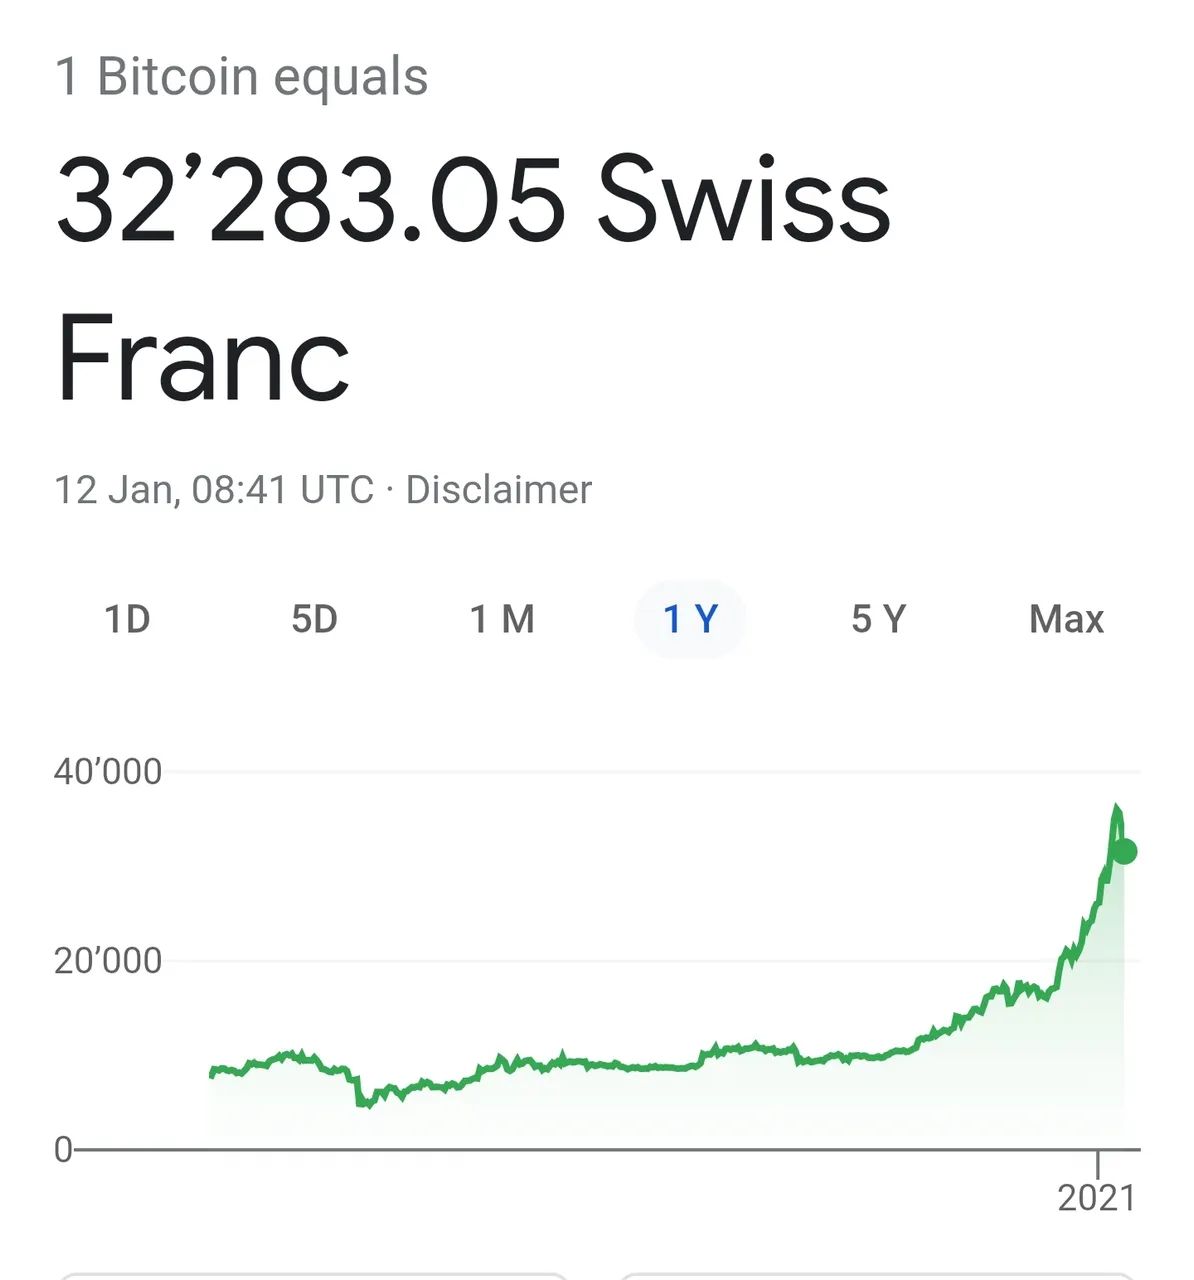
This is a picture I took of this morning's Bitcoin chart:
Not meaning to bust anyone's bubble but as a matter of fact it might already have. Take a look at this chart from 2018:
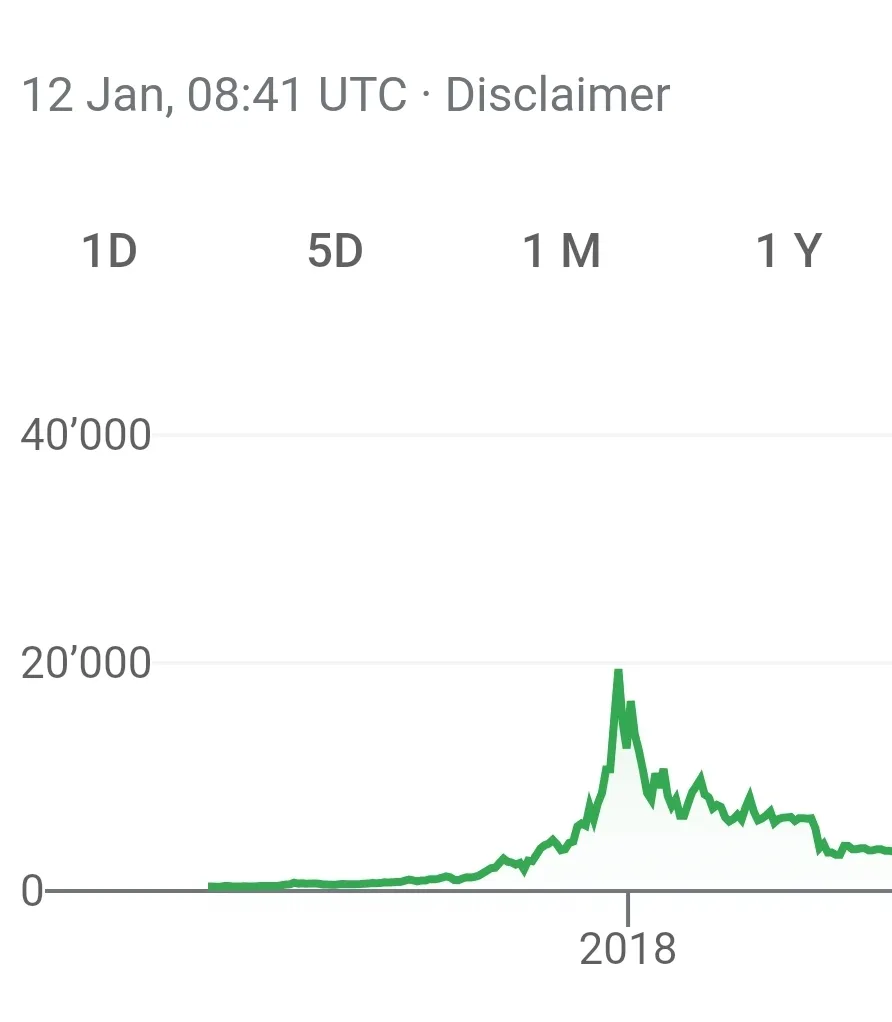
Maybe I'm overly dramatic but with Bitcoin charts history tends to repeat. Therefore we may be seeing a Bull Trap any day now and then it could be free fall to the first bump before the curve went parabolic (somewhere in the 15-thousands). From there it might slowly decline even further until reaching it's original level of 8k.
Disclaimer: No financial advice included in this article. Just my personal experience. Do your own research!
Images taken from Google search results