Hola mis amigos traders!! espero y esté bien. me alegro que mis post sean de su agrado y que la información suministrada les ayude en su mejoramiento al momento de analizar gráficas y así obtener buenos resultados.
Todo lo hago con el fín de ayudar a expandir el conocimiento en trading y que tengas una mejor visualización de la misma y así crecer como un gran trader.
Hoy les vengo hablar sobre lo que es el doble techo y doble suelo, tema posterior a soportes y resistencias. Éste tema chartista de gran ayuda nos ayudará a determinar hasta donde llegará o será el fín de una tendencia.
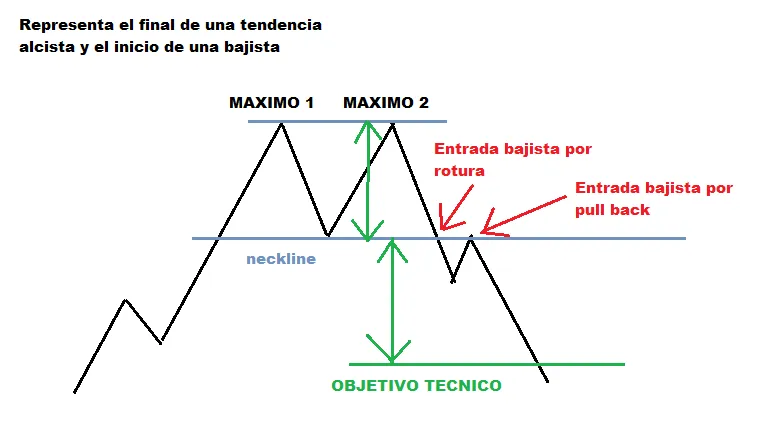
Ésta figura chartista llamada doble techo es usada para determinar el fín de una tendencia alcista. La cuál se produce cuando el precio toca un limite especifico par de veces, es decir, rebota se produce un rechazo y no puede seguir más su camino, como se puede apreciar en la imagen el máximo 1 depués hay una caida, luego un máximo 2 que se forma en el mismo y cae provocando un rompimiento.
La línea del medio llamada neckline formado por el mínimo, en el cuál hay una altura entre los máximos y el neckline, es la misma altura o distancia la cuál utilizaremos para saber la caida del precio y le llamaremos objetivo técnico.
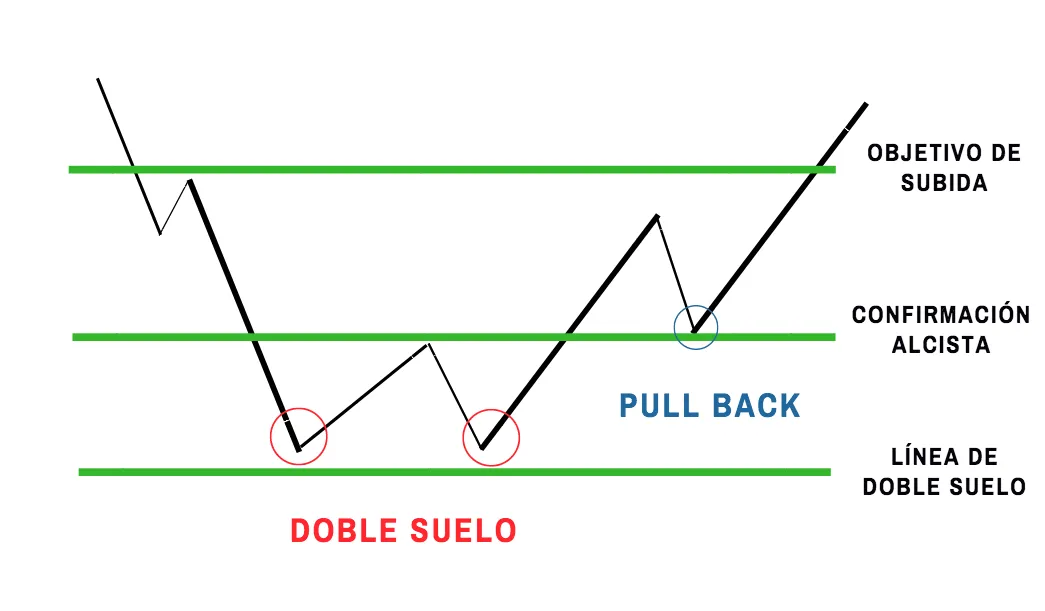
La figura del doble suelo es formada viniendo de una tendencia bajista en donde finaliza y se produce un mínimo en donde rebota llega a un precio en donde no puede romper esa resistencia y vuelve a caer produciendo otro mínimo en el mismo punto produciendose nuestro doble suelo y éste es rechazado de tal manera que rompe el neckline.
El neckline es la línea del medio esa distancia que se produce entre una línea y otra es la distancia cuál utilizaremos como objetivo de subida. cabe destacar que no todo el tiempo llega a ese objetivo, pero si se acerca de tal manera cumpliendo con la teoria.
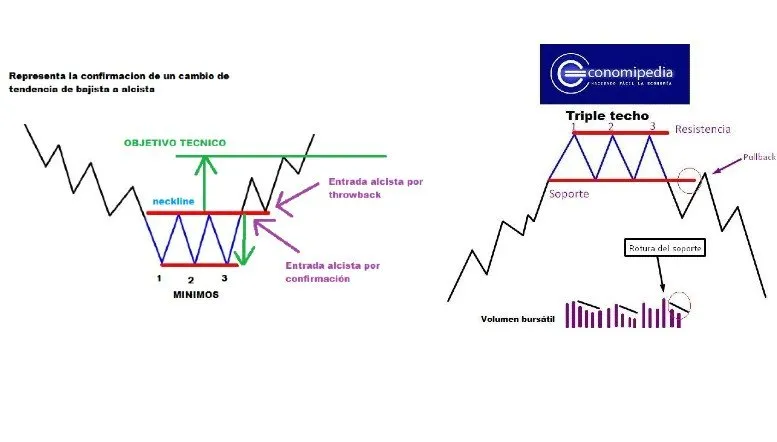
Así como se produce el doble techo y doble suelo, tambien nos encotraremos con este tipo chartista que se realiza cuando precio choca tres veces en el mismo punto y dos en el neckline estando debilitado ya en el tercero confima la ruptura y un cambio de tendencia.
A lo largo de la gráfica nos encontraremos con este tipo de figura chartista, es importante prácticar para desarrollar el dominio total y así saber cuando tener una buena entrada y obtener beneficios.
Por favor sigue estos consejos:
1- Analizar la gráfica.
2- Determinar la tendencia.
3- Analizar los patrones de la vela.
4- No operar en contra de la tendencia.
5- dejar las emociones a un lado.
6- Estar en un ambiente confortable o cómodo.
7- No adivinar (no es un juego de azar).
8- Investiga todo lo que puedas.
Nota: Con esto no estoy dando consejos de inversión ya que cada quien es responsable de invertir su dinero, simplemente comparto de mis conocimientos sobre lo que es el trading, ya que existen diferentes aspectos que se deben aprender para comenzar a operar en los diferentes mercados.
Cualquier pregunta, critica o sugerencia estoy abierto para ellos, me pueden dejar en los comentarios sobre que otro temas acerca del trading les gustaria compartir.
Sin mas nada que decir me despido, saludos mi amigos!!
****English****
Hello my trader friends!!! I hope you are well. I am glad that my posts are to your liking and that the information provided will help you in your improvement when analyzing graphs and thus obtain good results.
I do everything in order to help expand the knowledge in trading and you have a better visualization of it and thus grow as a great trader.
Today I come to talk about what is the double top and double bottom, a topic after supports and resistances. This chartist theme will help us to determine how far it will reach or will be the end of a trend.
This chart figure called double top is used to determine the end of an uptrend. Which occurs when the price touches a specific limit a couple of times, ie, bounces there is a rejection and can not continue its way, as can be seen in the image the maximum 1 then there is a fall, then a maximum 2 that is formed in the same and falls causing a break.
The middle line called neckline formed by the minimum, in which there is a height between the maximums and the neckline, is the same height or distance which we will use to know the fall of the price and we will call it technical objective.
The double bottom figure is formed coming from a downtrend where it ends and a low is produced where it bounces it reaches a price where it cannot break that resistance and falls back down producing another low at the same point producing our double bottom and this is rejected in such a way that it breaks the neckline.
The neckline is the middle line that distance that occurs between one line and another is the distance which we will use as a target rise. it should be noted that not all the time reaches that goal, but if it is approaching in such a way fulfilling the theory.
Just as the double top and double bottom occurs, we will also encounter this chartist type which is realized when price crashes three times at the same point and twice at the neckline being weakened already in the third one confiming the breakout and a change of trend.
Throughout the chart we will find this type of chartist figure, it is important to practice to develop full control and thus know when to have a good entry and profit.
Please follow these tips:
1- Analyze the chart.
2- Determine the trend.
3 - Analyze the candlestick patterns.
4- Do not trade against the trend.
5- Leave emotions aside.
6- Be in a comfortable environment.
7- Do not guess (it is not a game of chance).
8- Do as much research as you can.
Note: With this I am not giving investment advice since everyone is responsible for investing their money, I am simply sharing my knowledge about what trading is, since there are different aspects that must be learned to start trading in different markets.
Any questions, criticisms or suggestions I am open to them, you can leave me in the comments on what other topics about trading would like to share.
With nothing more to say I say goodbye, greetings my friends!!!