Two weeks ago, as October started with a pretty sharp decline when everyone was looking forward to the bulls running wild, I analyzed the various options, and in all cases, seemed like mid-October would be the key. This is one of the things I said:
If it bounces off of the moving average, then chances are we might see a V-shape recovery and pushing higher from there on the mid term if/when we get a golden cross, which coincidentally, might be around mid-October too.
I was talking about the bitcoin price and its MA50. Looks like we are in that scenario.
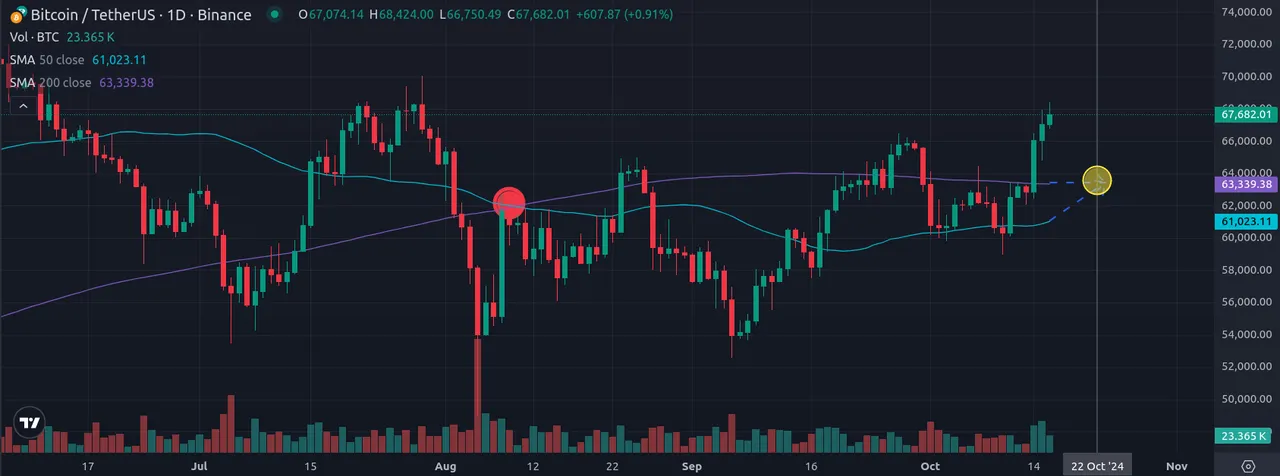
It wasn't V-shape, it would have been too soon, it was W-shape, in the end, but looks like the mid-October estimate was pretty accurate.
I marked on the chart above the 50-day moving average (in cyan) and the 200-day moving average (in purple). When the two intersect we have what are called death or golden crosses. If the MA50 goes above MA200, that's a golden cross, if MA50 goes below the MA200, that's a death cross.
Death crosses sometimes confirm a longer period of under-performing price action may follow (bear market), while golden crosses sometimes confirm a longer period of over-performing price action may follow (bull run).
Death or golden crosses need to happen on high volume to be relevant. They are trailing indicators, meaning they are strong confirmations of trend changes that already happened.
I marked the last death cross with a red full circle on the chart above. You can see the market already has been in a downtrend for a good while before this indicator kicked in.
In the following couple of days it is likely we will have a golden cross, although MA200 acts as a strong resistance, and we might have the bulls rejected at that level. If however, the bulls push through the MA200 line on high volume, we will likely see a strong rally to continue, possibly for months, with some dips.
Below, I include the same chart for a longer time frame.
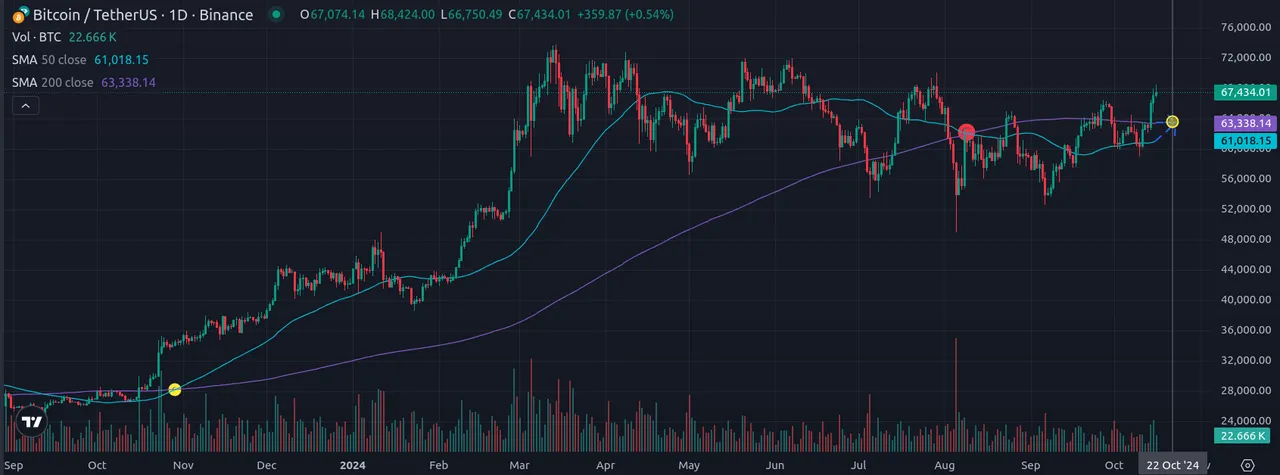
Look at the previous golden cross from October 2023. The uptrend kept going till the ATH in March 2024. The death cross didn't occurred till August 2024, though. Do you see what I mean about trailing indicator? If the price would have crashed significantly (as it happens in the bear market), the death cross would have come sooner, but still with a lag.
I could have gone even further in the past on the chart and show you that this indicator generally works, especially if you are seeking mid-long term entry or exit point confirmations. Test it yourself on a chart you are interested in!