
As I try to understand and apply the strategy there are a couple of things to identify aside from market speculation, Im trying to build up a checklist and back test it based on the indicators to verify if my theory is valid or biased.
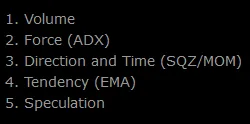

1- Volume: as the price keeps going up the volume has been decreasing, bellow I can tell each time the price goes higher, each peak has less volume and is starting to form an arch.
2- Force: the ADX indicator is showing a decrease in force, meaning that even though the price is going up there is not much demand, its like when there is water on the pipe put without much pressure to fill the entire pipe, the bullish price action is about to either stop, making a sideways action or drop in a not so distant future
3- Direction and Time: The SQZ is showing there is a bearish divergence, it does not mean price is going to drop but eventually might, divergence are not a certainty but AS I UNDERSTAND there is a high probability its respected. At this point in time the direction is about to turn bullish in the short term but this is the part that I’m having a hard time to understand and the reason I’m testing this theory. As the SQZ builds up a red valley getting closer to point 0 and ADX picks up force I would expect the price to go higher close to $70k
4- Tendency: The price is currently above the brown EMA (55 EMA) meaning it remains bullish until its not anymore, for this reason I believe the price can have another and probably last positive impulse before it starts to correct as its loosing force and momentum.
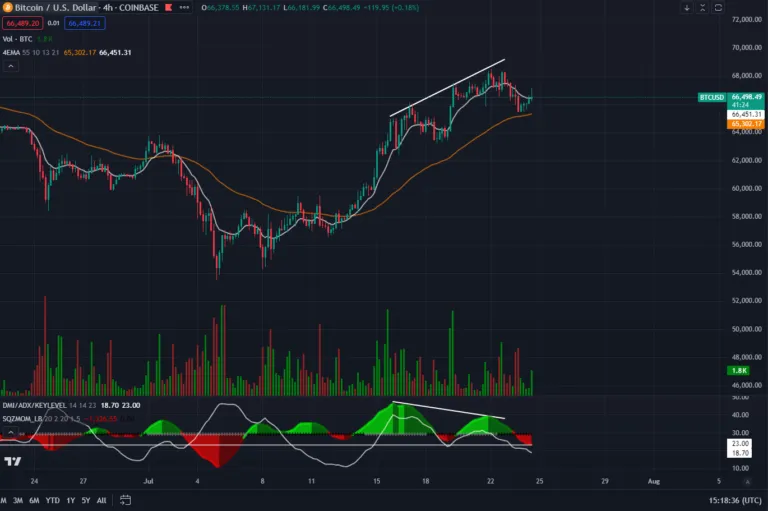
5- Speculation: my speculation side of the market is that everyone is waiting for Bitcoin to break ATH and as the price becomes weak it could get close to $70k and fool everyone once again, causing a correction on a higher level chart like THE 1D, I have my entry at $64498 with a 2% stop at $63200 with a take profit at $69k, thats close to a 38% gain using 5x leverage.
I set my order last night, if it does not get filled I would most likely cancel it WHEN the SQZ hits point 0 and I dont see any movement on the price or the ADX is not gaining force, meaning the price might not go up as I thought.
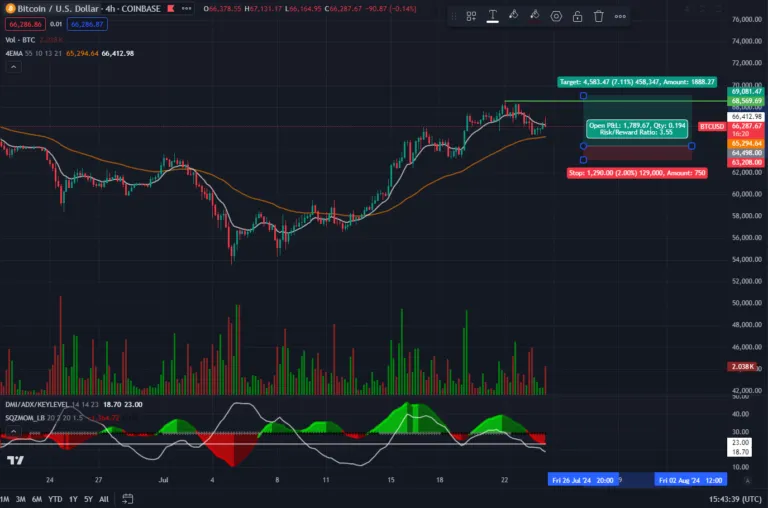
Why is my stop at $63500?? because I think that’s is the lower part of the range the price will start to form on the 1D chart, going through the same checklist as before the price would get into a range and if within a range of 10 days, about the first week of August we could see the price go up again, it has been my believe based on pure speculation that around August price would start to pick up once again. If it then breaks the $63k level for some reason then it would then retest the low $50k level and its better that I get stop out for a 10% of my trade and that means I was wrong.
This strategy is suppose to have some what close to 70% effectiveness.