In my previous post I where talking about a retest of the neckline of the inverse head & shoulder at 25k before 32k. And we got, just as with the retest of 20k and the CME gap in February. 😃
Short term we either get a retest of 25k which is addback to longs before 32-33k. Imo is 28-33k tough resistance, when we overcome it we should continue the rally and target 36k, the target of the inverse head & shoulder, and then the fib targets at 42k and 48k. Invalidation will be close below the neckline of the pattern for any reconsideration.
The retest at 25k came in the form as a falling wedge, after breakout we hit almost 32k, for now been consolidating into a bullflag just waiting for a breakout. If so 35-36k should come fast. Break to the downside we might visit 28 or 25k again..
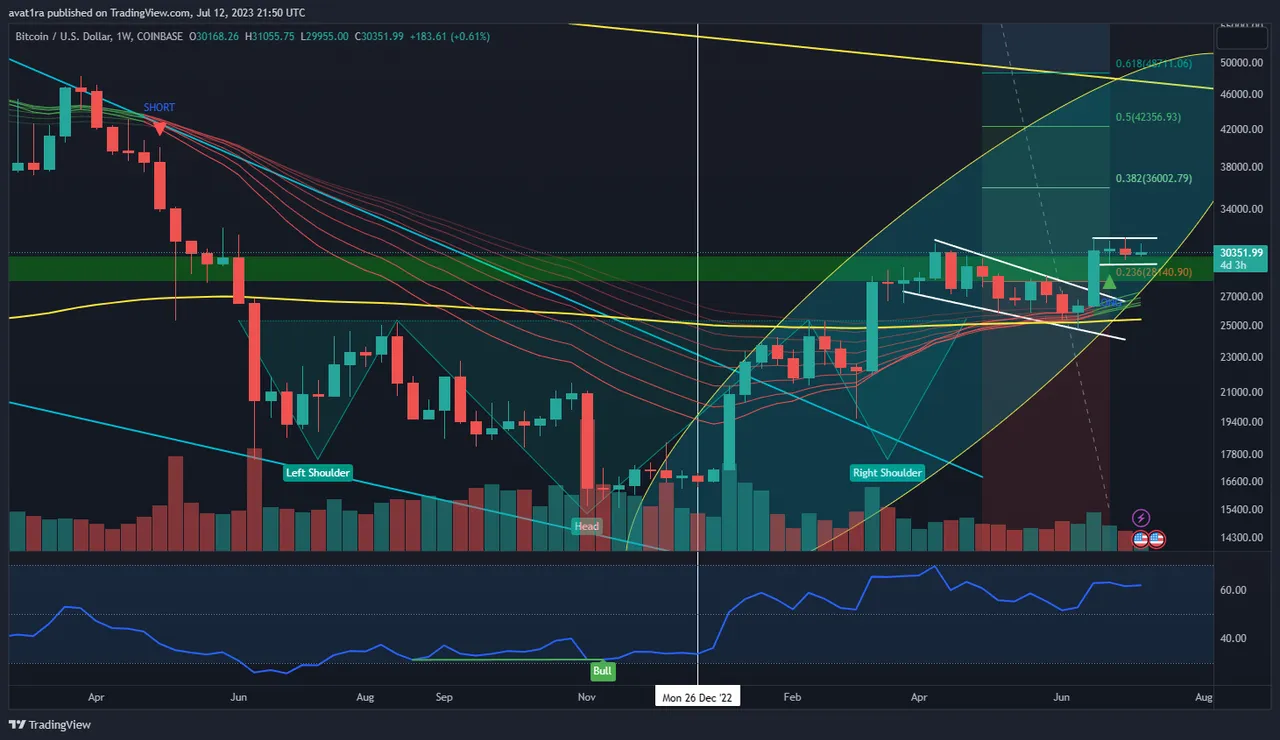
There is not much else to add, everything is going as expected it just takes time. From the weekly bullish divergence last year that send us to test blue trendline, the retest of it and right shoulder to the retest of the neckline if you have been following my BTC updates. Now just waiting for my next predictiv move to hit of 35-36k. The same invalidation level is a candle close below the 25k neckline for any reconsideration which held for now. I don't think it will be tested again until the local top is in, but we might get a fakout to 28k before break of 32k.
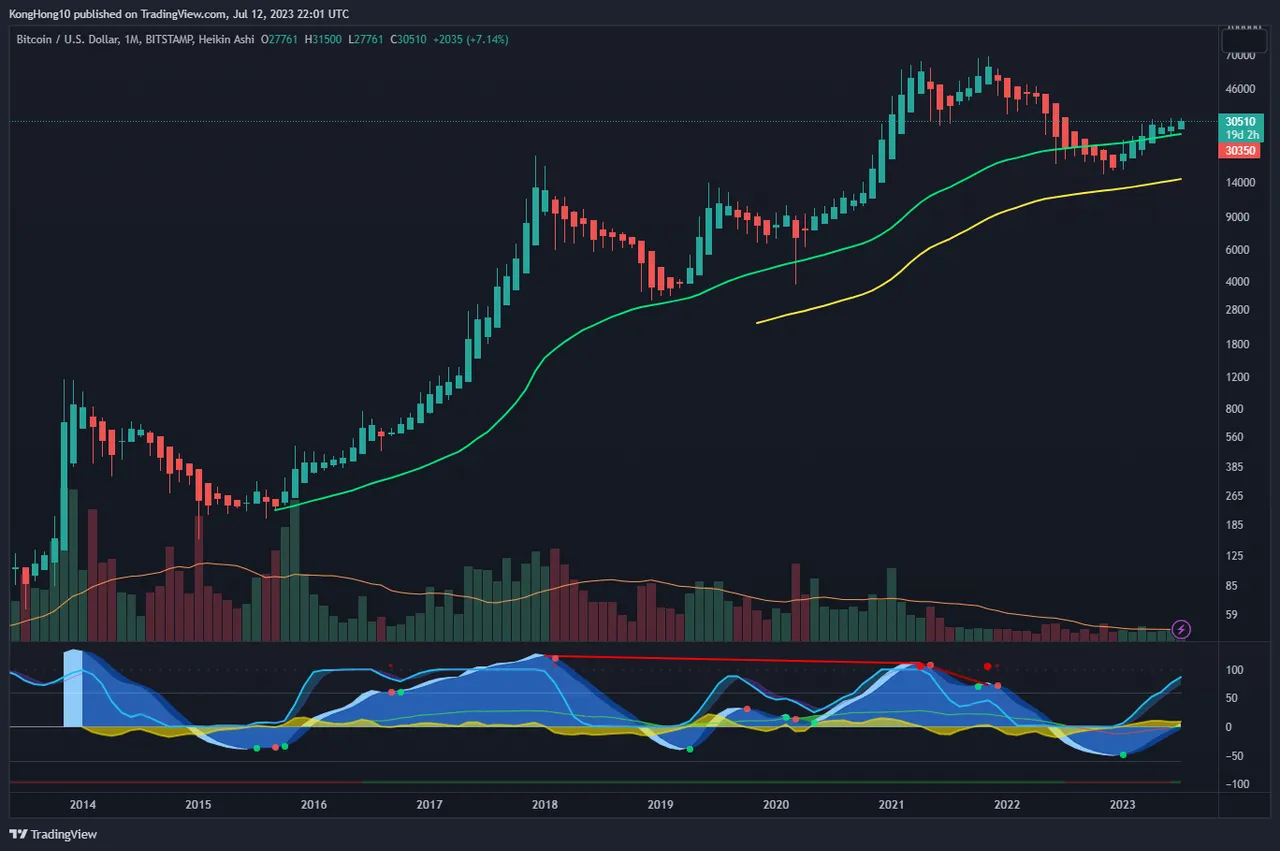
And on monthly chart with Heikin Ashi candles everything looks great. Question is will we mirror 2016 or 2019. If its gonna be 2016 we should see 6 months sideways basically before a new high, and no signifintly lower lows on monthly chart before next bulltop, that would be nice. And as mentioned in previous post. 😊
on this indicator, there has only been 4 green dots printed below the zero line ever, and all led to lots of upside.
I hope you enjoyed the read and leave a comment, where are price going next?
Please do follow if you want to keep up with my next post. Any upvotes or reblogs are hugely appreciated!
Latest post, check out :
Playing Civilization Again #4
Christopher
Kristiansand, Norway
Source: Photos are chart-screenshots by me from Tradingview.com
follow for our street art contest and blogs about travel, art, photo, crypto & gaming