2023 has been a rough year for Curve. There was a hack on the protocol and somewhere around $50M has been stolen. The hack itself was specific to a few pools and not all the protocol was affected. The overall total value locked prior to the hack on the protocol was more than 3.5B, meaning that just a small amount of the deposits was affected.
But what has added an additional risk to this is that the founder of Curve has a massive loan on his founders’ tokens CRV. He has taken a massive loan of 100M USD and more on AAVE and everyone is able to see this. There was an over the counter deals (OTC), in which the founder sold some CRV tokens to big players like Binance got some stables and partially paid off the debt. Recently there have been speculations that the founder still has a big debt and there is a still fears of liquidations and defi contamination.
Curve is a stablecoin DEX. It provides swaps of big amounts of stablecoins with the lowest slippage.
At one point Curve had the largest TVL of all the defi apps. The now fallen TerraUST project had its biggest liquidity pool on Curve. Apart from stablecoins it is also used for other derivatives that have a counter partner of 1 to 1 ratio. This has come in handy for liquid staking projects like staked ETH and ETH pools.
Here we will be looking at:
- Total value locked
- Trading Volume
- Number of users DAUs MAUs
- Top Pairs
- Price
The data here is compiled from different sources like DefiLama and Dune Analytics.
Total Value Locked
Here is the chart for the TVL on Curve.
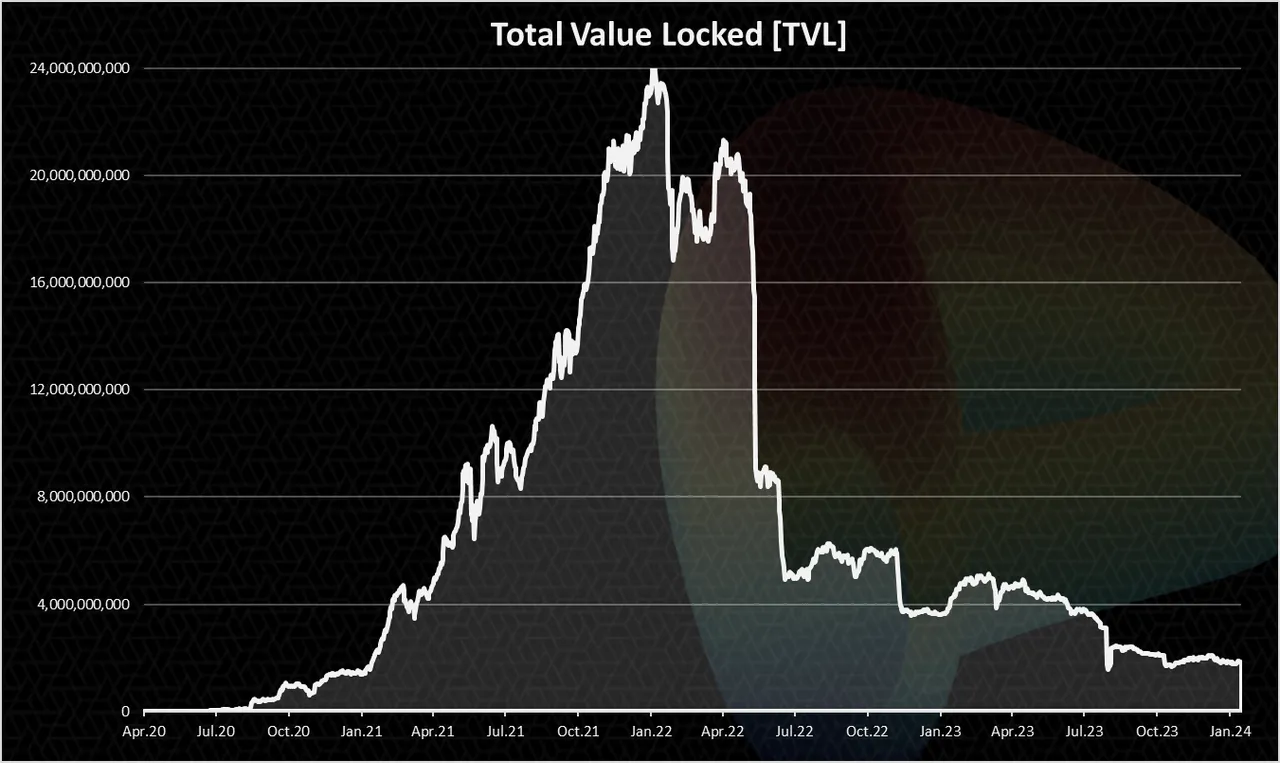
We can see the heights in TVL on Curve were reached back in January 2022 with 24B in deposits. Shortly after, in May 2022, there was a massive drop in TVL from more than 20B to 5B. This was due to the collapse of UST. A total of 15B TVL was removed from Curve in a period of a month.
When we zoom in 2023-2024 we have this:
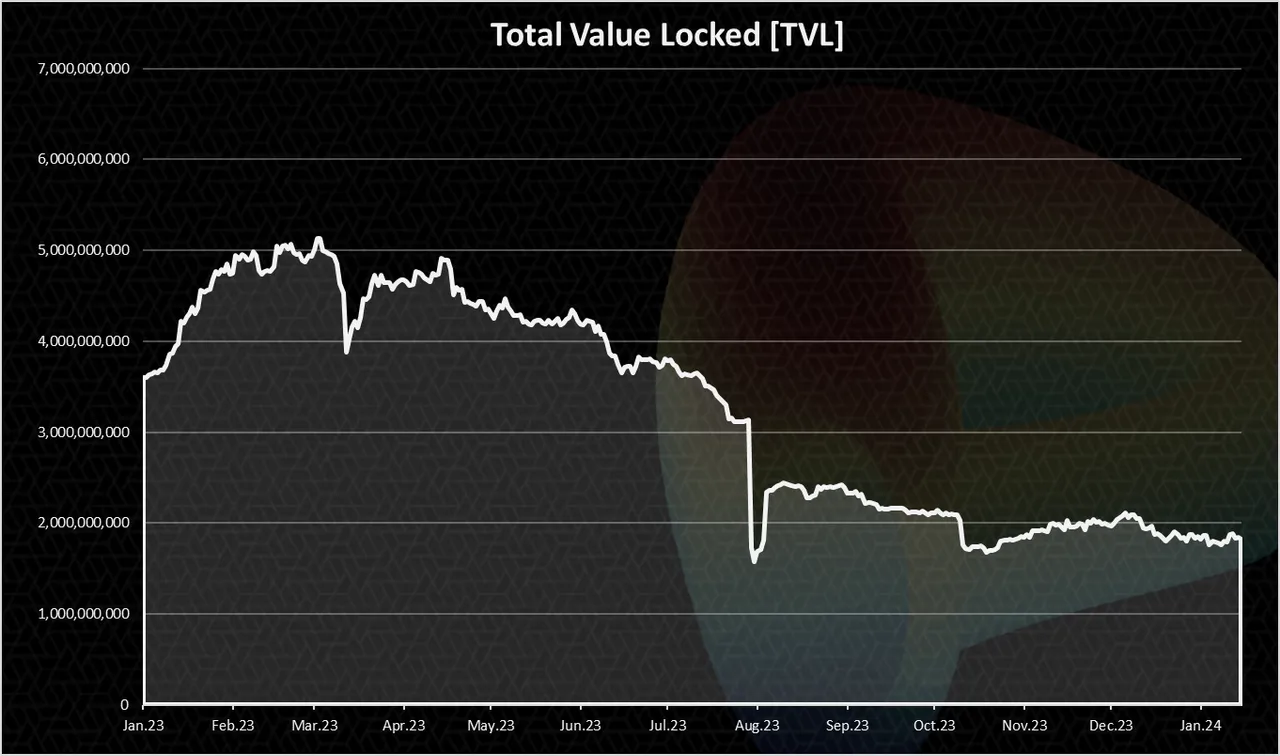
2023 started with under 4B in TVL. It increased going forward to 5B in April and a slow drop afterwards. Then in July a sharp drop from 3B to 1.6B in days when the hack happened. A small recovery afterwards, and a stabilization in the last months of 2023 with around 2B TVL on Curve. Far from the ATH of more than 20B.
Trading Volume
Trading volume is extremely important. That is where the fees come from and the APR for liquidity providers. No trading volume means no fees and no capital in the protocol.
The chart for the trading volume looks like this.
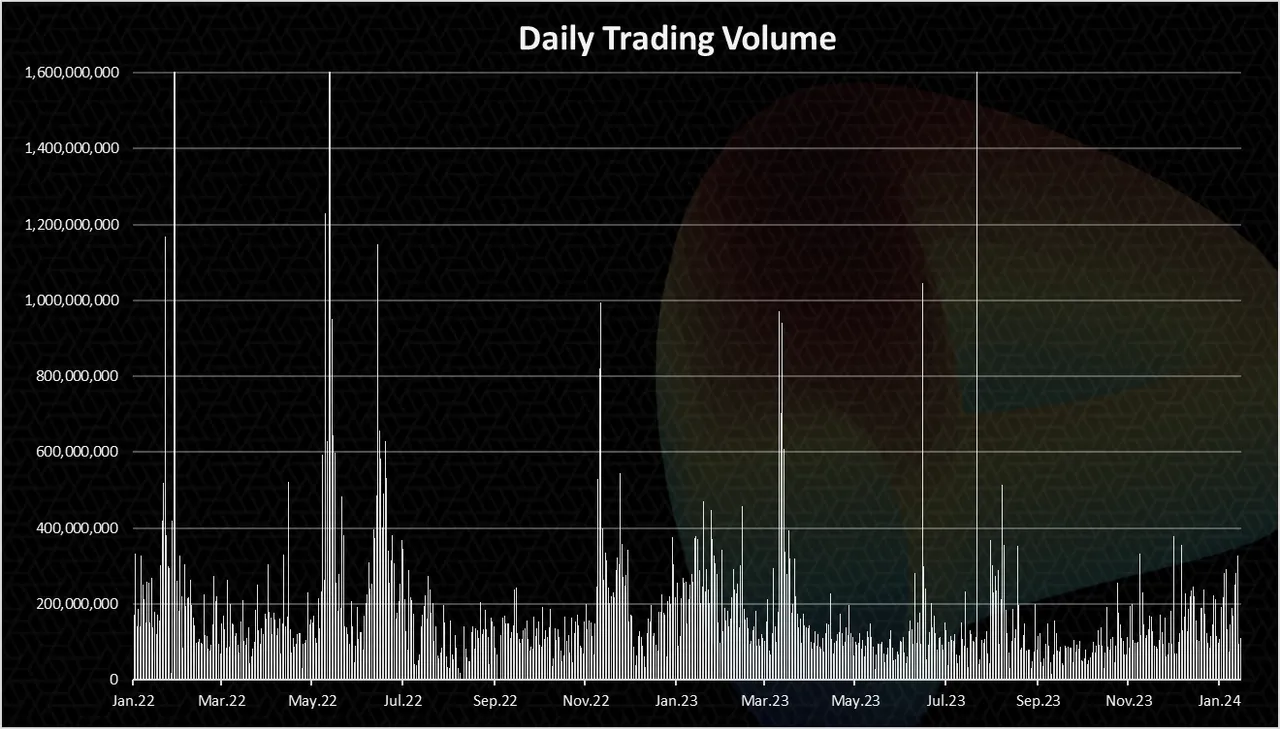
There are a few spikes in the trading volume up to 2B daily on occasions. This usually happens when there are some market volatilities like with FTX and UST.
On regular days the trading volume has been quite constant in the range of 100M to 200M per day.
Some uptrend is noticeable in the last period with the daily trading volume in the range of 200M to 300M.
The chart for the monthly trading volume looks like this:
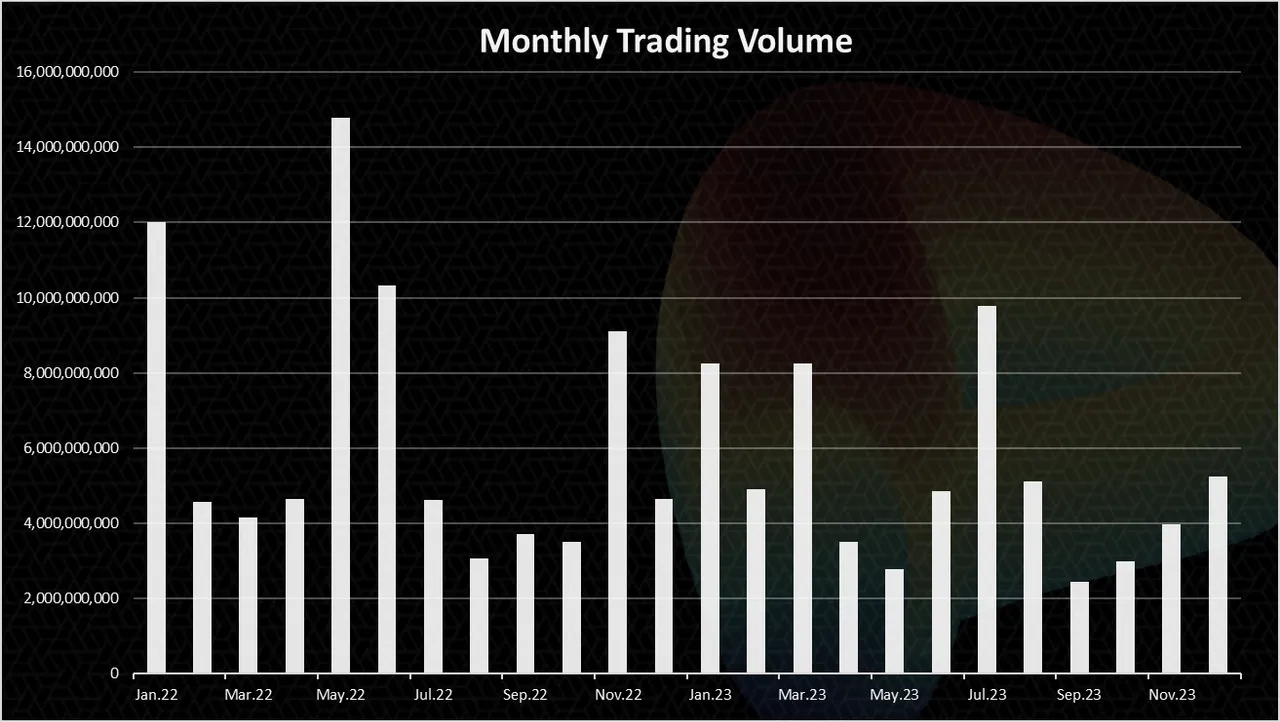
We can notice the high trading volume in May 2022, when UST happened.
July 2023 is also up a lot when compared with the previous months due to the hack.
In the last months of 2023 the trading volume has been constantly being up with December having 5B in trading volume.
DEX VS CEX Volume
If we take a look at the data for the trading volume on the other exchanges provided by some of the aggregators like coingecko the numbers looks like this.
An example for January 15, 2024:
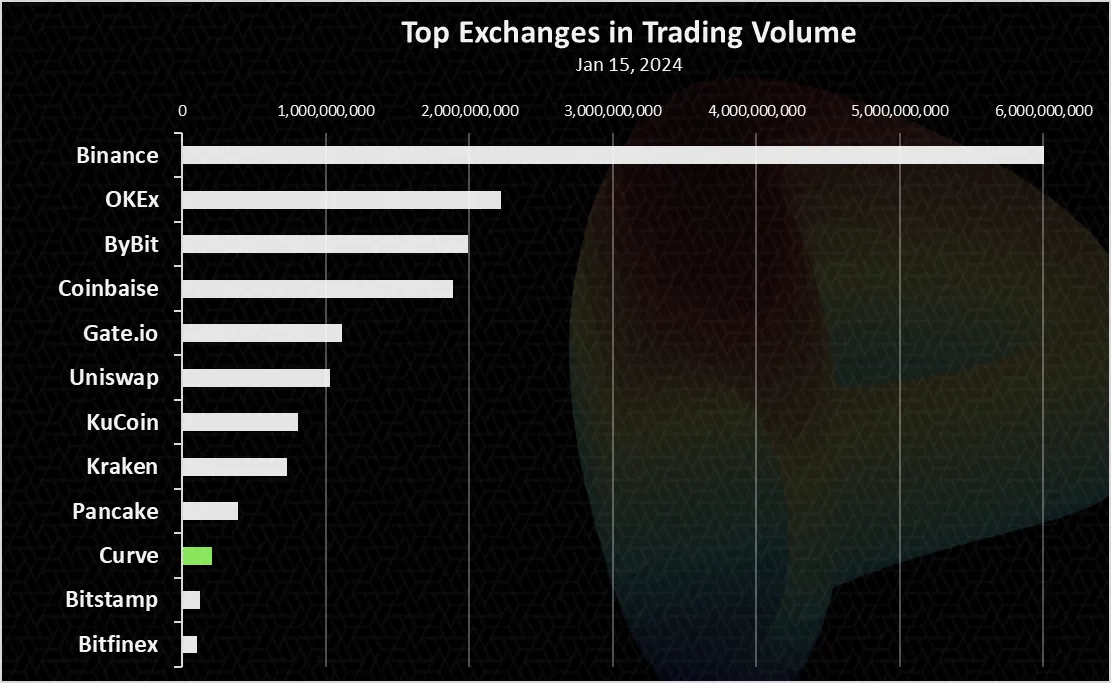
We can notice Curve is in the top 10 exchanges, both CEXs and DEXs. Binance is on the top here with 6B trading volume for the day. Another DEXs in the top are Uniswap and Pancake.
Curve comes on the 10th spot with 200M volume for the day.
Active Users
How many users does Curve has? Here is the chart.
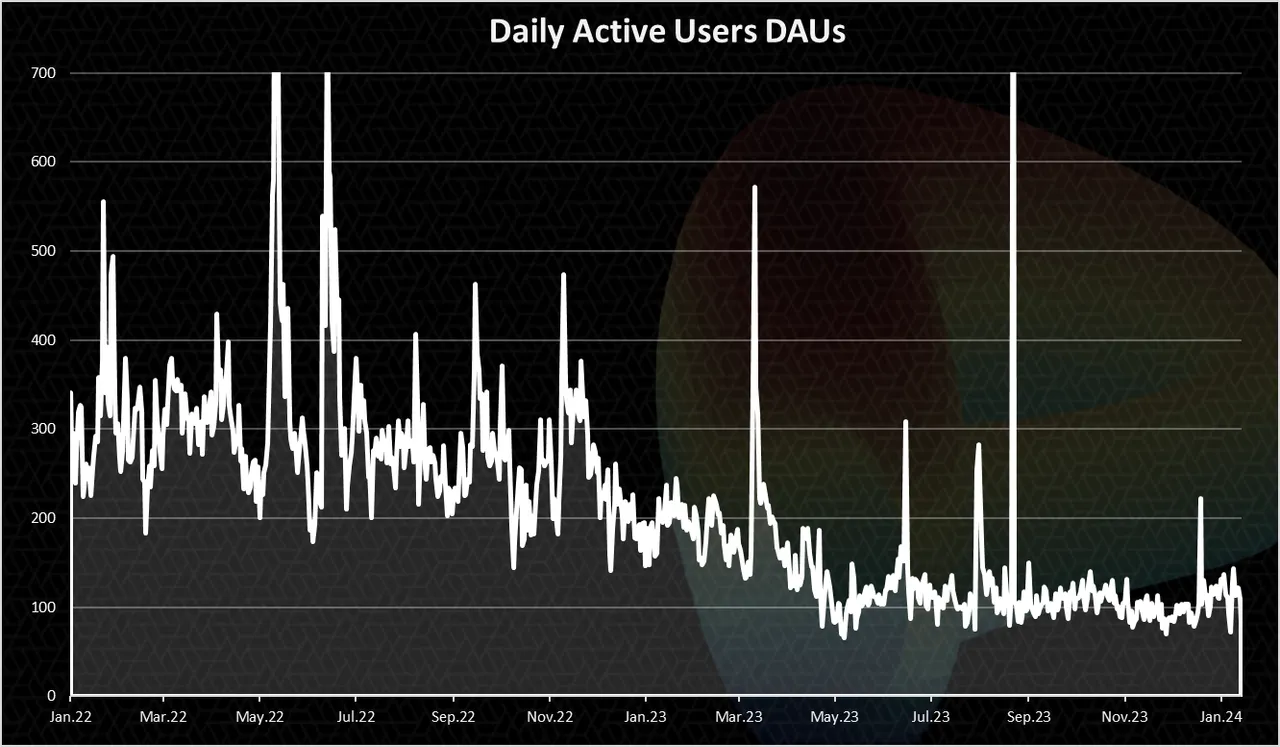
Curve does not have that many users, and the numbers have steadily gone down in the period. Throughout all the year there have been between 100 to 200 DAUs, with occasional spikes to 500 or more. This again shows the protocol is used on an industrial level, from other apps and not by individual users. It makes sense since its primary use is for large stablecoins swaps. Not a lot of users have a large amounts stablecoins to swap around.
On a monthly basis the chart looks like this:
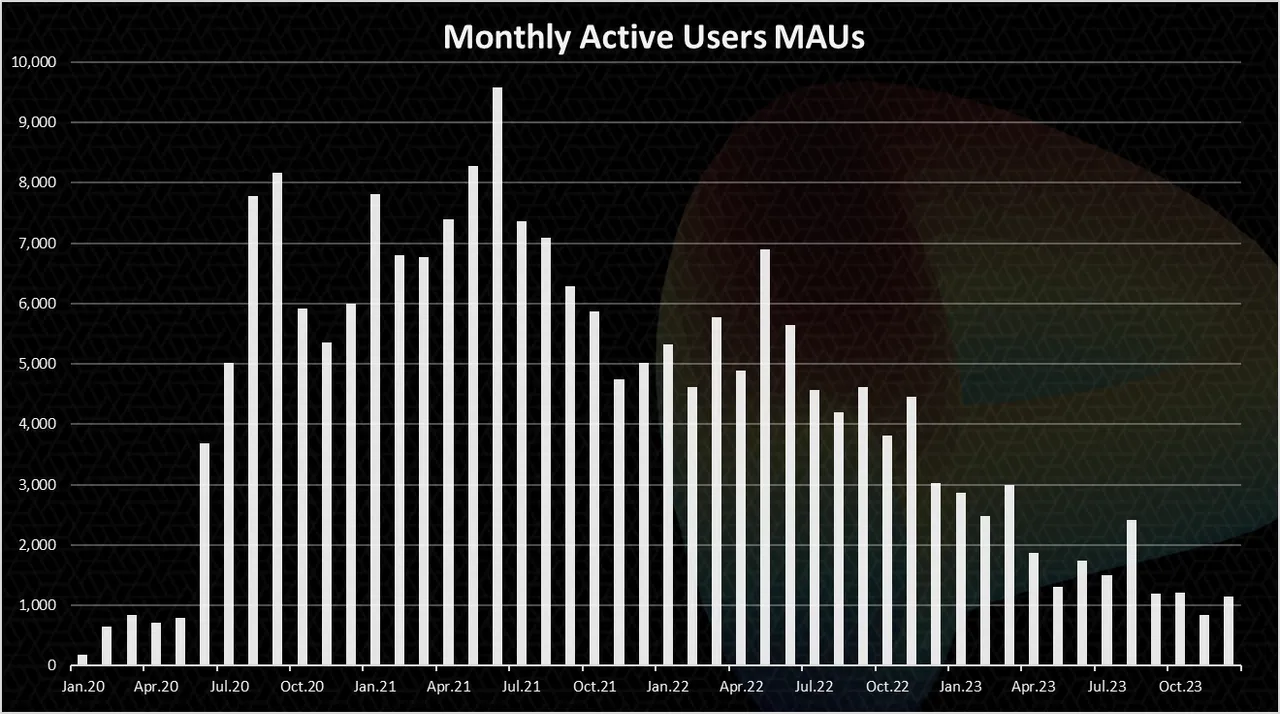
The number of monthly users is a bit higher than the daily ones and it is around 1k. In the last two years it has dropped from a record high of 10k to 1k now.
Top Liquidity Pools on Curve
Here is the chart for the top pools ranked by liquidity.
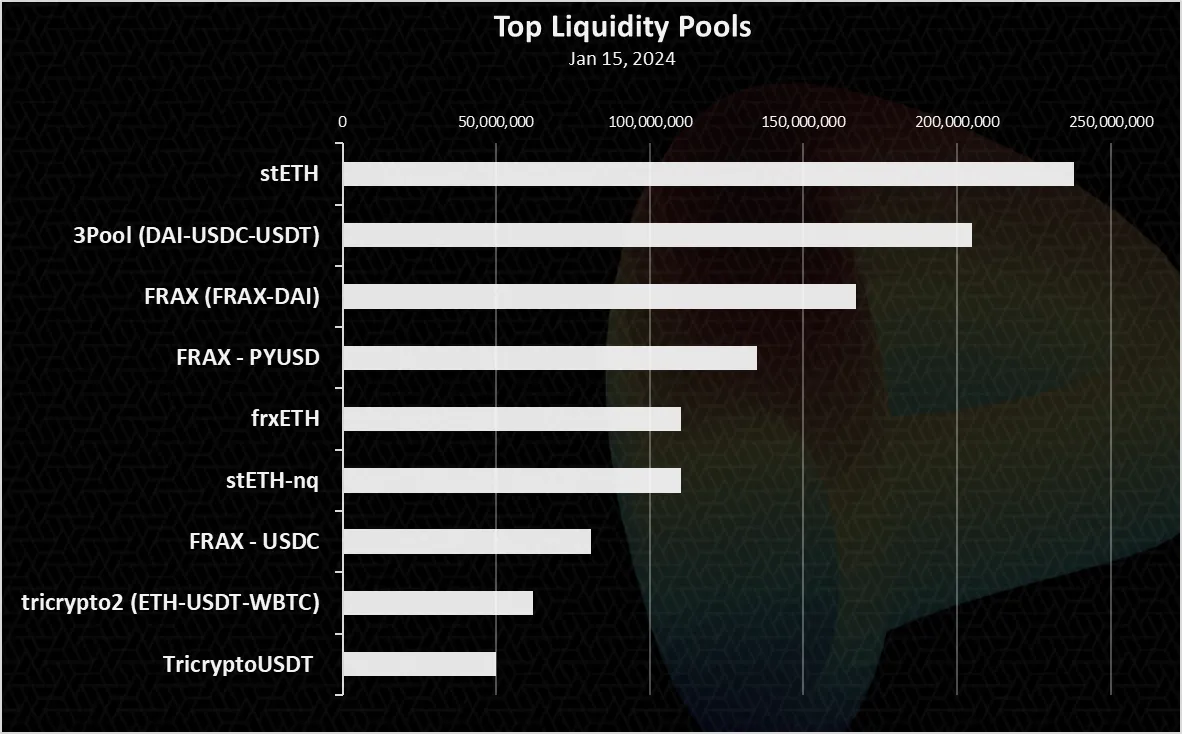
The stETH pool is in the first spot with 235M. Not a stablecoin pool but a ETH derivative from liquid staking. Next is one of the oldest pools on Curve the 3Pool (DAI-ISDC-USDT), followed by a FRAX-DAI pool. FRAX has multiple pools in the top 10, and cumulative is probably the biggest asset on Curve.
Price
The all-time chart for the CRV price looks like this.
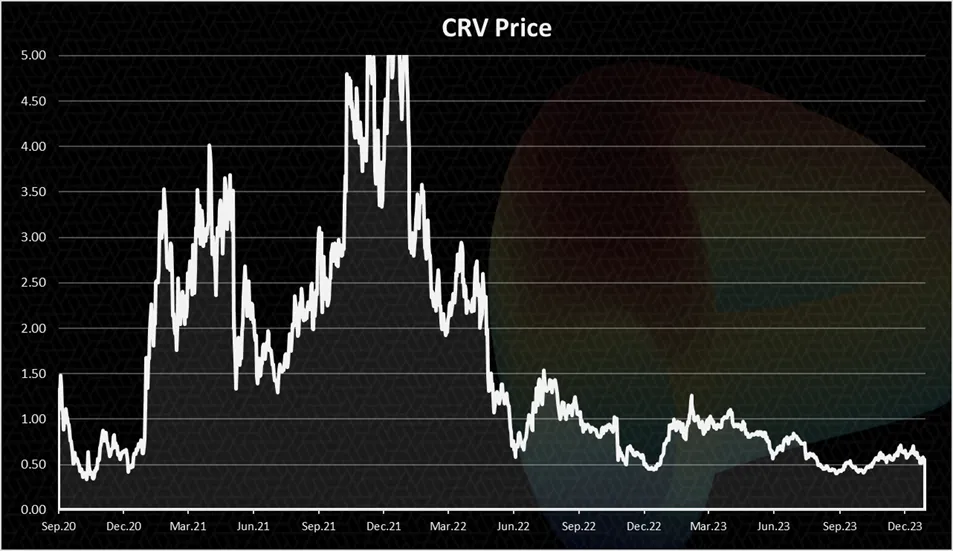
Quite the downtrend for the token. The bear market has been especially rough for defi coins and CRV is not an exception. At the top the CRV token was worth more than $6. Now it stands at around 0.5. On a few occasions it dipped to bellow 0.5. Basically a 90% drop in the price.
It remains to be seen how things will evolve on Curve, but the hack in the combination with the founder behavior has been a major blow. The gamble like attitude of the founder has enhanced the risk from events like the recent hack. Obviously, the founder has a major stake from the token, probably more than 20%, causing a risk for the overall project.
The staked ETH pools were a major new development for Curve, with a lot of liquidity locking in those pools, because the ETH to stETH acts like a stablecoin pools. But we have seen that even this liquidity has been exiting the protocol. Overall, not the best position for the protocol to be in.
All the best
@dalz