Curve has been going trough a rough period. There was a hack on the protocol and somewhere around $50M has been stolen. The hack itself was specific to a few pools and not all the protocol was affected. The overall total value locked prior to the hack on the protocol was more than 3.5B, meaning that just a small amount of the deposits was affected.
But what is adding an additional risk to this is that the founder of Curve, has a massive loan on his founders’ tokens CRV. He has taken a massive loan of 100M USD on AAVE and everyone is able to see this. This loan has been there for more than a year now, and there have been risks of liquidation in the past as well. But this is the first time the protocol to have a major hack. Recently the loan has been paid off partially and the position is now close to 50M. Still, it is a large amount of tokens, and if they get to liquidate there will be a massive sell of the CRV token.

Curve is a stablecoin DEX. It provides swaps of big amounts of stablecoins with the lowest slippage.
At one point Curve had the largest TVL of all the defi apps. The now fallen TerraUST project had its biggest liquidity pool on Curve.
Here we will be looking at:
- Total value locked
- Trading Volume
- Number of users DAUs MAUs
- Top Pairs
- Price
The data here is compiled from different sources like DefiLama and Dune Analytics.
Total Value Locked
Here is the chart for the TVL on Curve.
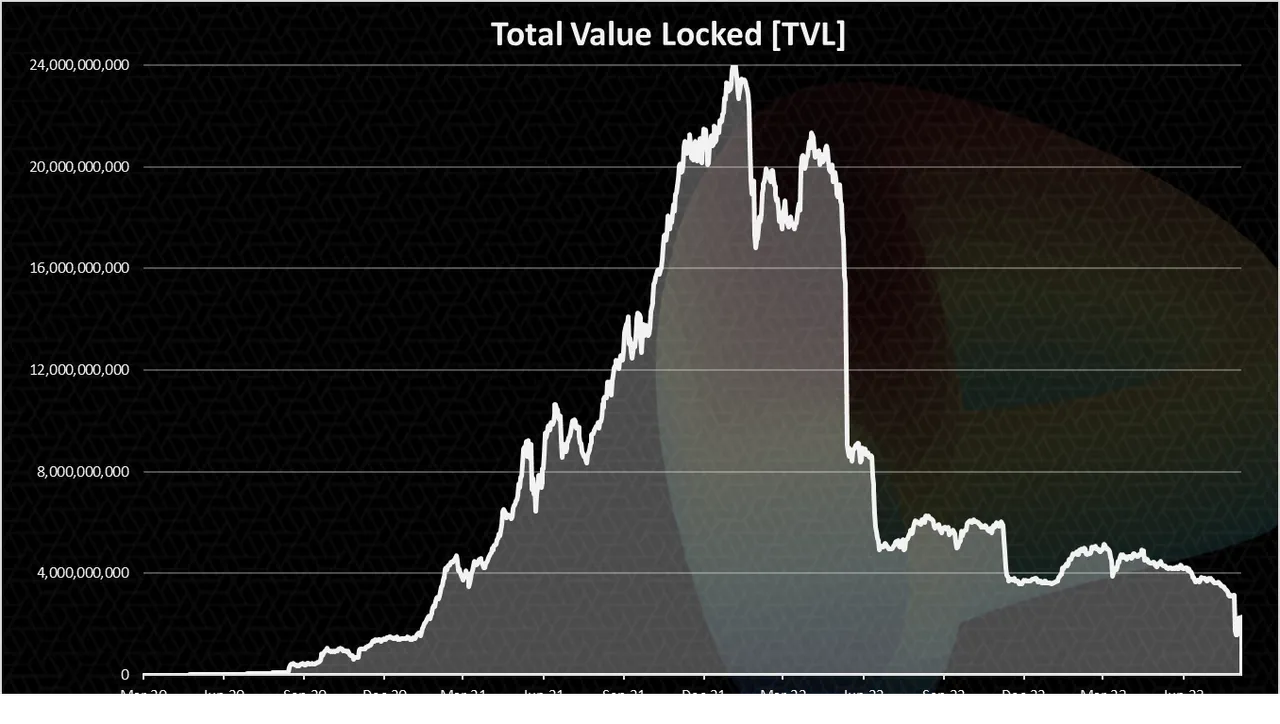
We can see the heights in TVL on Curve were reached back in January 2022 with 24B in deposits. Shortly after, in May 2022 a massive drop in TVL from more than 20B to 5B. This was due to the collapse of UST. A total of 15B TVL was removed from Curve in a period of a month.
When we zoom in 2023 we have this:

The year started with under 4B in TVL. It increased going forward to 5B in April. Since then, it has been in a slow decline, and in the last week we can see the sharp drop from 3B to 1.6B in days. It seems that a part of the losses in TVL has been recovered and the protocol now seats at 2.4B.
Trading Volume
Trading volume is extremely important. That is where the fees come from and the APR for liquidity providers. No trading volume means no fees and no capital in the protocol.
The chart for the trading volume looks like this.
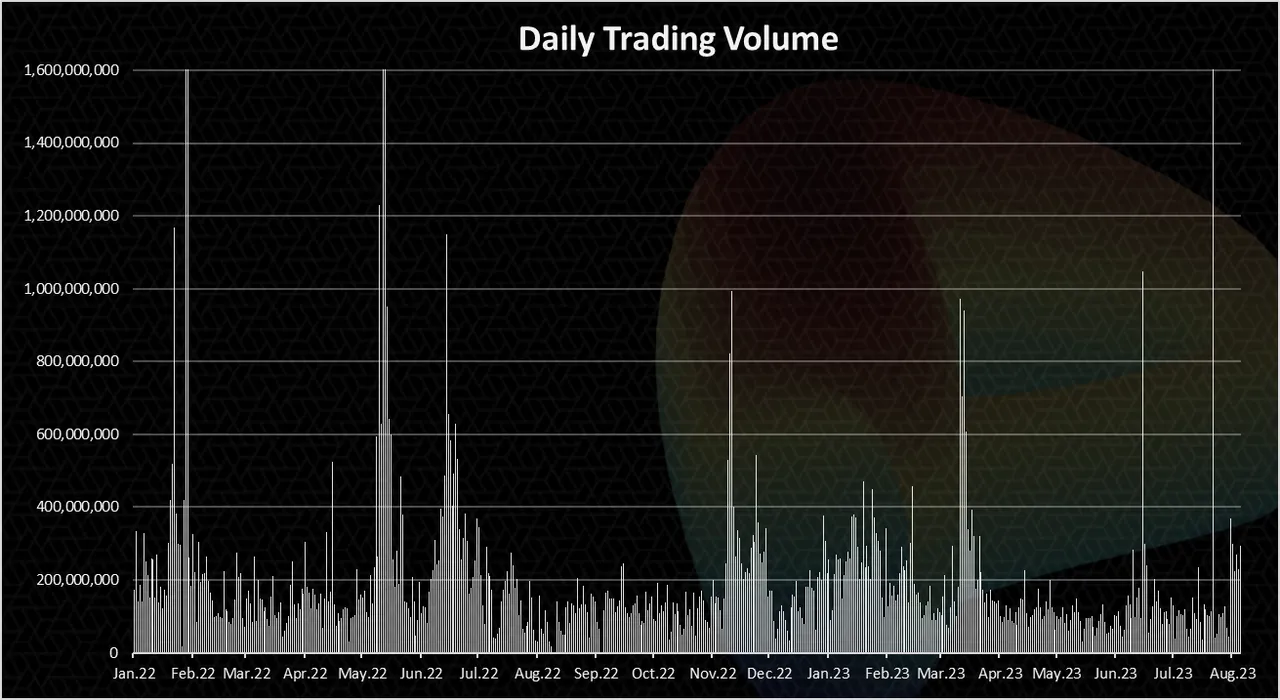
There are a few spikes in the trading volume up to 2B daily on occasions. This usually happens when there are some market volatilities like with FTX and UST.
On regular days the trading volume in 2022-2023 has been quite constant in the range of 100M to 200M per day.
Some uptrend is noticeable in the last days with the daily trading volume in the range of 200M to 300M. This due to the market volatility on the protocol itself.
The chart for the monthly trading volume looks like this:
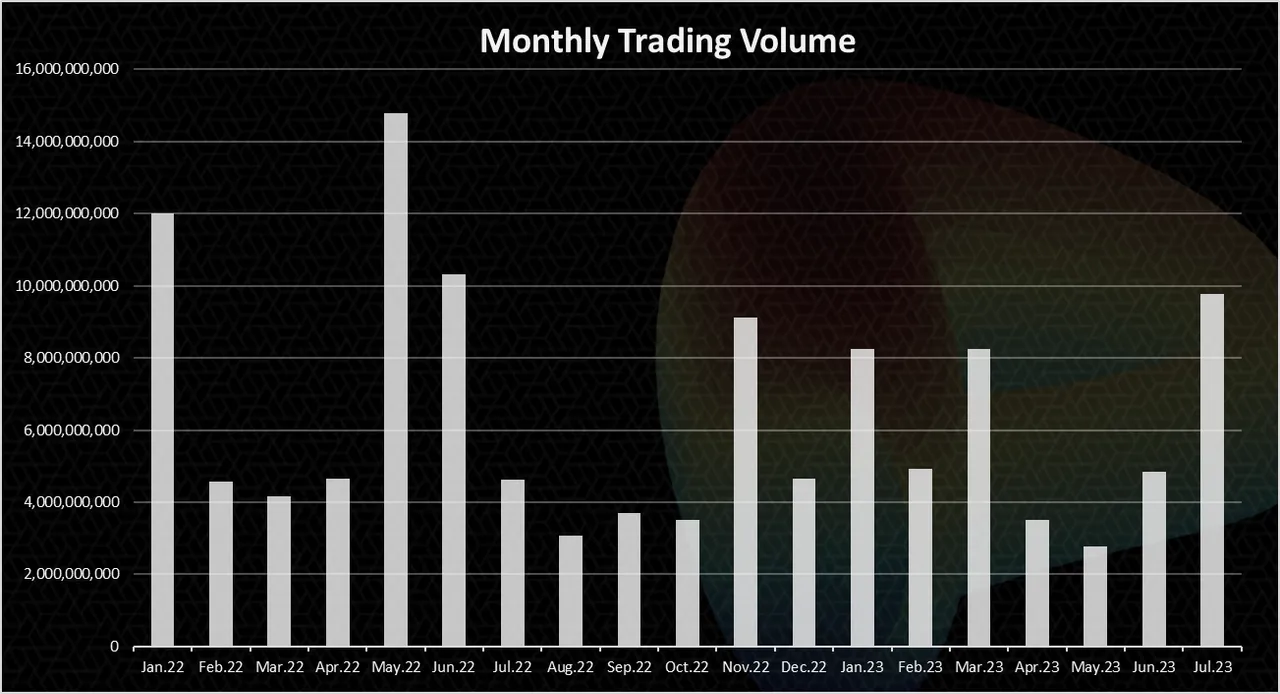
We can notice the high trading volume in May 2022, when UST happened.
July is also up a lot when compared with the previous months. May 2023 as example was just around 3B, while July is now at 10B.
DEX VS CEX Volume
If we take a look at the data for the trading volume on the other exchanges provided by some of the aggregators like coingecko the numbers looks like this.
An example for August 6, 2023:
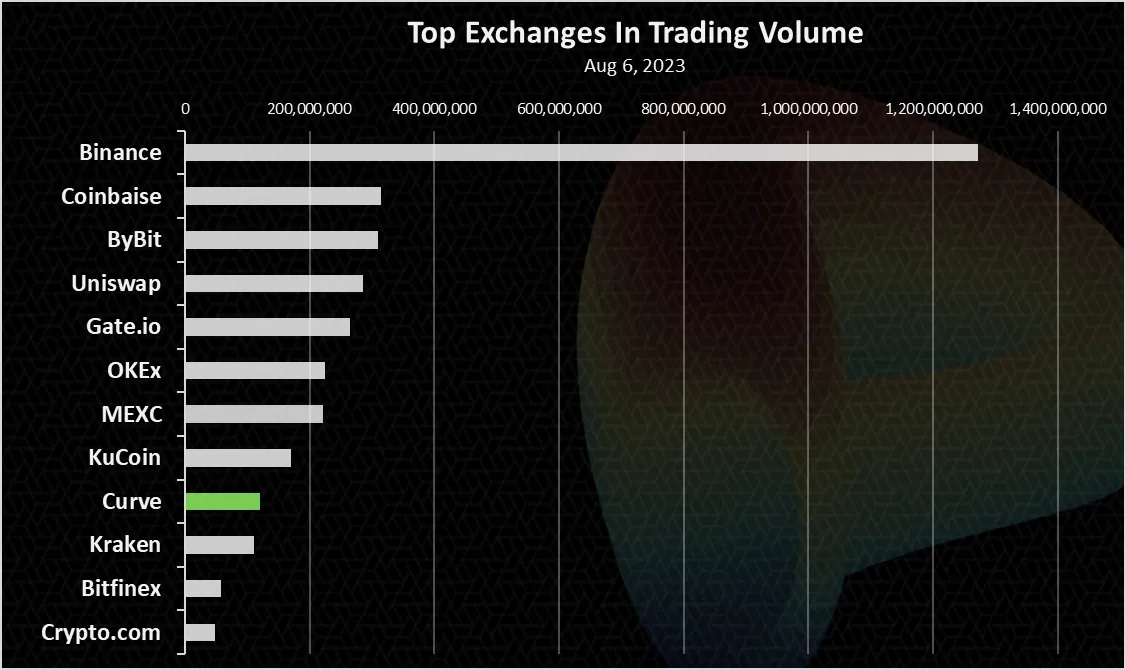
We can notice Curve is in the top 10 exchanges, both CEXs and DEXs. Binance is on the top here, followed by Coinbase. These two have positioned themselves as the top two major CEXs now. ByBit has emerged as then number 3, after the FTX collapse.
From the DEXs, Uniswap still ranks higher, and up to recently on a few occasions it has surprised Coinbase, becoming the number 2 of all exchanges.
Curve comes on the 9th spot with 120M volume for the day.
Active Users
How many users Curve has? Here is the chart.
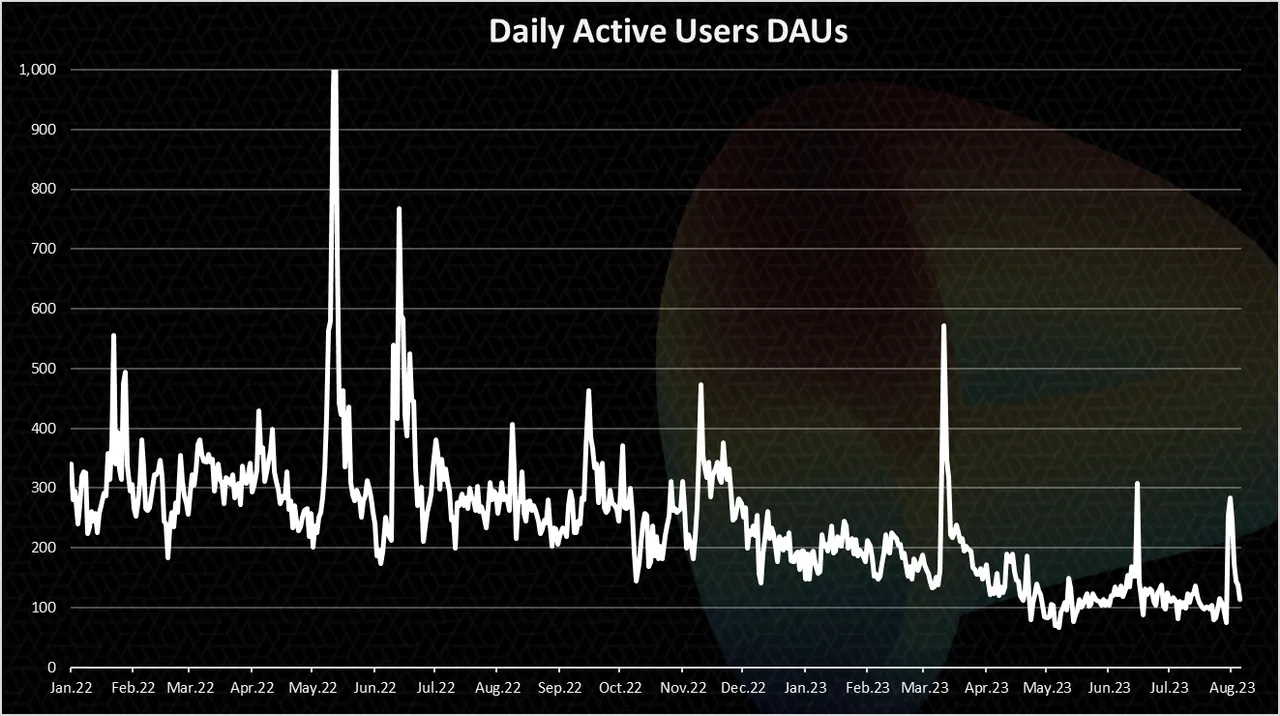
Curve has not that many users, and the numbers have steadily gone down in the period. Throughout all the year there have been between 100 to 200 DAUs, with occasional spikes to 500 or more. This again shows the protocol is used on an industrial level, from other apps and not by individual users. It makes sense since its primary use is for large stablecoins swaps. Not a lot of users have a large amounts stablecoins to swap around.
On a monthly basis the chart looks like this:
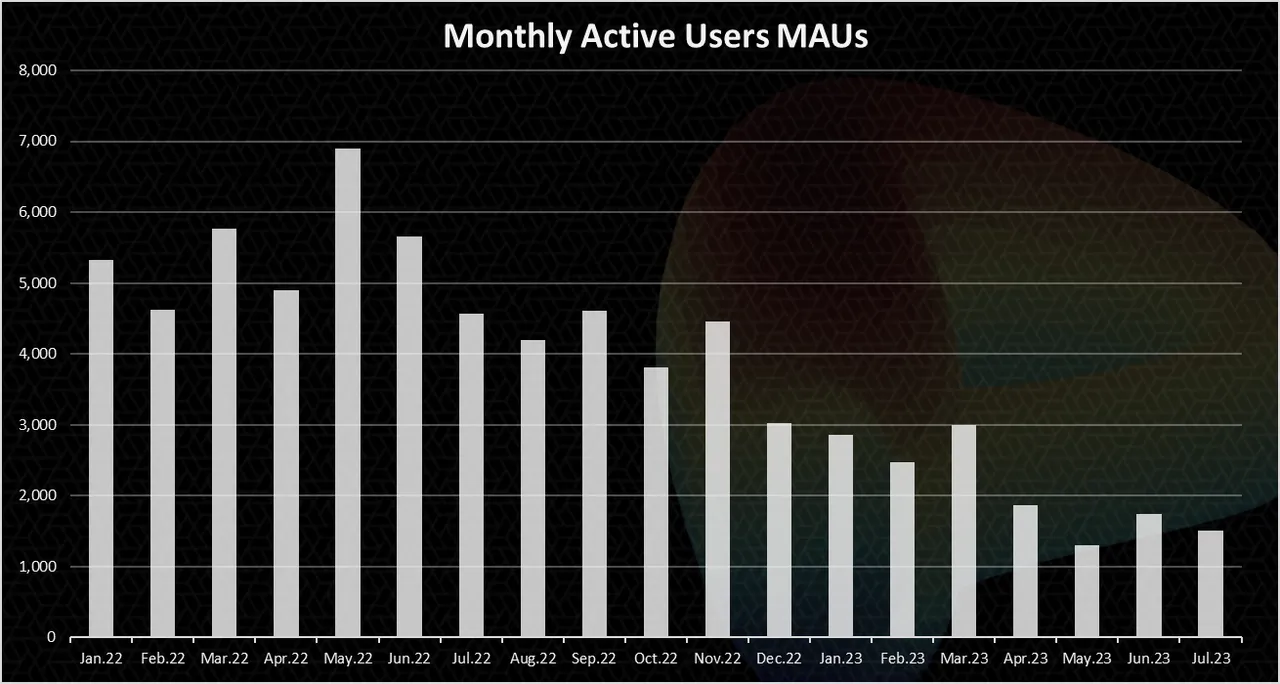
The number of monthly users is a bit higher than the daily ones and it is around 2k. In the last three months this number has been between 1500 to 2000. Back in May 2022 the top was with around 7k MAUs.
Top Liquidity Pools on Curve
Here is the chart for the top pools ranked by liquidity.
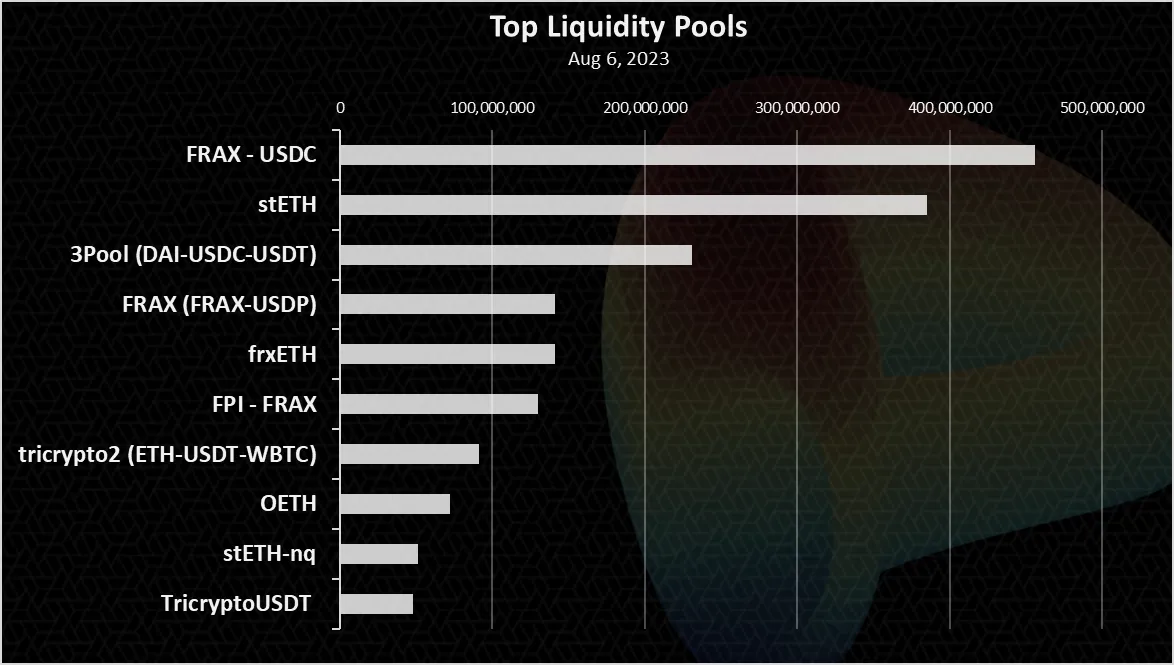
The FRAX-USDC is on the top here with a value of 450M at the moment. The stETH pool is on the second spot with 385M. This pool seems to have dropped the most, because a few months back it was worth more than a billion.
The other pools are predominantly stablecoins. The 3Pool (DAI-USDC-USDT) has been one of the major ones, some more FRAX pools and staked ETH pools.
The tricrypto2 (ETH-USDT-WBTC) is in the top as well.
Price
The all-time chart for the CRV price looks like this.
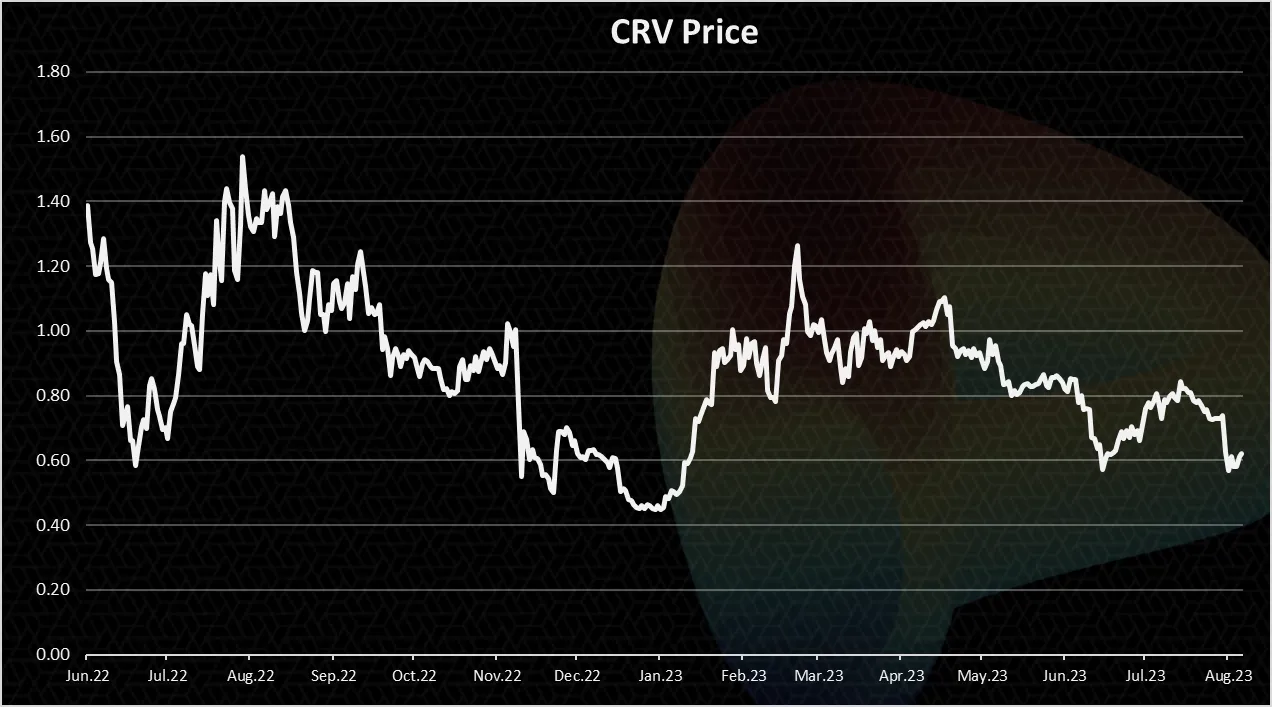
Quite the downtrend for the token. The bear market has been especially rough for defi coins and CRV is not an exception. At the top the CRV token was worth more than $6. Now it stands at around $6. On a few occasions it dipped to around 0.5. Basically a 90% drop in the price.
It remains to be seen how things will evolve on Curve, but this hack has been a major blow. The gamble like attitude of the founder has enhanced the risk from events like the recent hack. Obviously, the founder has a major stake from the token, probably more than 20%, causing a risk for the overall project. The staked ETH pools were a major new development for Curve, with a lot of liquidity locking in those pools, because the ETH to stETH acts like a stablecoin pools. But we have seen that more than one billion in the staked ETH pools has exited the protocol now. It’s a major concern for the protocol, and a lost of trust. But this being crypto, users can be with a short memory and it might go back as business as usual in a few months.
All the best
@dalz