Foreword:
Most of my readers do not stay in Singapore and may not be able to appreciate this post. For the benefit of them, I will briefly explain what is COE. My main aim of this post is to get more Singaporeans to know about Steem.
For Singaporeans who just know about Steem through this post, Steem is a censorship-resistant content platform. Instead of profiting from your activities like other mainstream social networks, this platform rewards your attention with cryptocurrencies. To learn more, check out this site or connect with me on Twitter/Discord (culgin#1360).
Source
What is COE?
COE stands for certificate of entitlement. In Singapore, it is not your birth right to own a car even if you have the money. Every 2 weeks, there will be an auction for potential car owners to bid for a limited quota of COE. The price of COE is therefore determined by demand and supply. There are other intricacies to the COE system and I recommend you to read about it on Wikipedia.
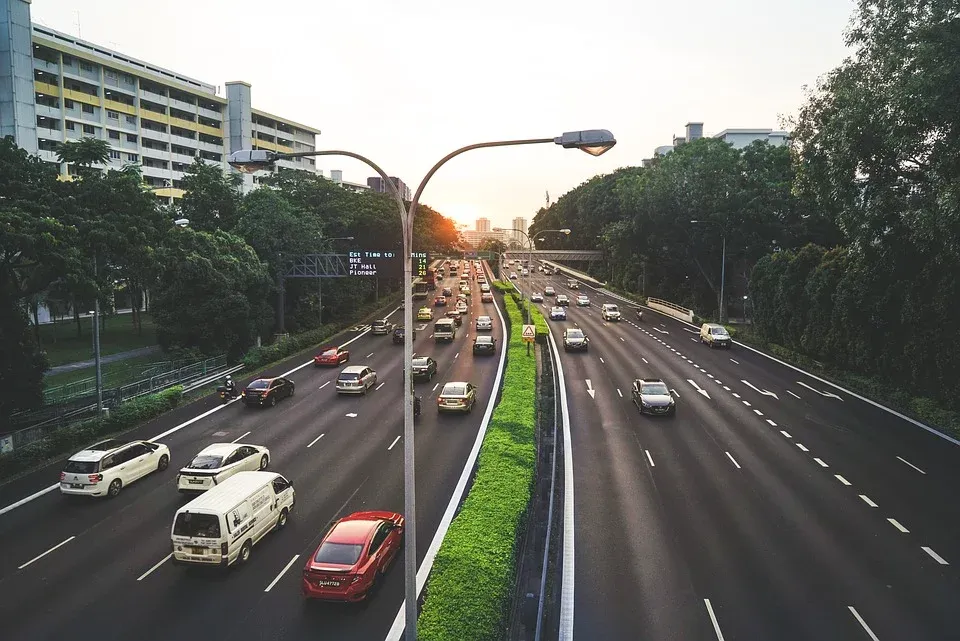
As absurd as it might sound, the COE system is in my opinion quite effective in keeping the roads in Singapore free of congestion. Singapore is a small island-state with population density and many affluent people who can afford a car. Without this system, there will bound to be too many cars on the road leading to frequent congestion. Though this system is effective to ease traffic, I think it can be made fairer but I will leave the discussion to a future post instead.
How can COE prices predict a recession?
Owning a car in Singapore is more of a want than a need. We have a relatively reliable and cheap public transport system and Singapore is so tiny. There is seriously not much need to own a car unless you need to ferry your family members around on a daily basis. As a result, in theory, the demand for COE will increase when people are feeling rich and optimistic that they can afford to own a car. On the flip-side, when people are uncertain of their jobs and income, demand for COE is then expected to be low.
Through this post, I am going to explore if COE prices can be used to predict future recession. I will be using historical data and analyze if COE prices always drop before a recession.
Normalizing Data
The COE system started in the 1990s and along the way, there were 3 key changes. Before 1992, there were only 4 categories of COEs, each category represent a type of vehicles. Then in 1992, the number of categories expanded to many as 8. The number of categories was reduced to 5 in 1999. Finally, in 2002, the monthly auction system was changed to a fortnightly auction.
I am highlighting these changes because in order to normalize the data, I decided to give up the data from 1990 and 1991. This is because during those period, there was no "Open" category. "Open" category simply means that the COE can be used for any vehicle type, much like a wildcard. This category was introduced in 1992 and exists till now.
In addition, the data points prior to 2002 was monthly. To compare recent data points that are fortnightly, I average the 2 prices in a month to get the monthly data point. Finally, I also factored in inflation so that we can get fair price comparisons.
My data is collected from the following sources. Special thanks to the data providers!
- http://tralvex.com/pub/cars/coe.htm (data prior to 2002)
- https://coe.sgcharts.com/ (data from 2002 onwards)
- https://www.singstat.gov.sg/ (data on annual inflation)
- https://tradingeconomics.com/singapore/gdp-growth-annual (data on recession in Singapore)
Analysis Based on Price
For my analysis, I am focusing on 2 categories of vehicles. First, it is the "Open" category, which in theory represents the general sentiments of the Singapore population. A high price translates to a high demand which means that the general population in Singapore "feels good" about the economy and the future. On the other hand, a low price might signify fear, uncertainty and doubt (FUD).
Then I also look at the "Commercial" vehicle category, this in theory represents the sentiments of businesses in Singapore. The definition for these 2 categories also remain largely the same from 1992 till now, which makes them the easier categories to work with.
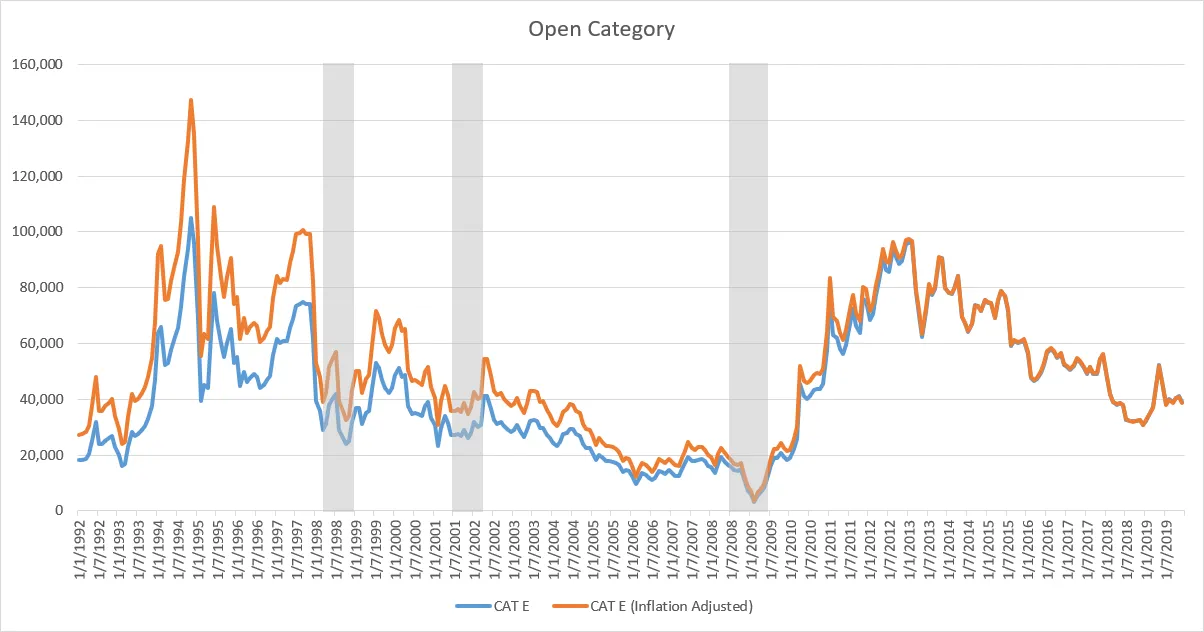
The blue line is the historical "Open" category COE prices while the orange line is adjusted for inflation. The grey areas are the recession years. Note that recession is defined by 2 or more consecutive quarters of negative GDP growth. This happened thrice in Singapore between 1992 till now. The first one was between Q2 - Q4 of 1998, which I believe is due to the Asian Financial Crisis. The second one was between Q3 2001 and Q1 2002, likely a result of the dot-com bubble. Finally, between Q3 2008 and Q2 2009, there was a recession due to the Great Financial Crisis which I believe is still fresh in our memories.
In the above chart, a sustained period of COE price drop seems to indicate a incoming recession. It is also interesting to note that the COE price tend to "bottom out" during the recession periods. Prices were suppressed during the period of recession and took off when the economy is out of recession.
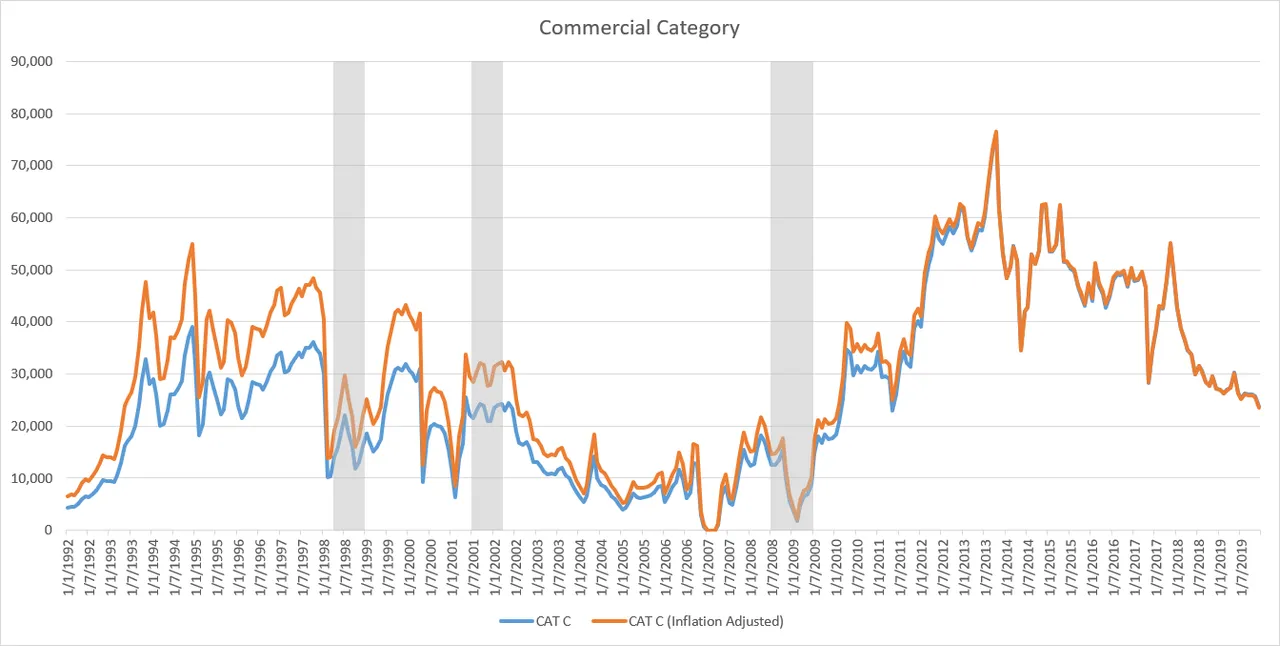
Similarly, in this next chart, the blue line is the historical "Commercial" vehicles category COE prices while the orange line is adjusted for inflation. The grey areas are the recession years. The chart is similar to the "Open" category one in the sense that there is a sustained period of price decline prior to the recession. However, interestingly, price tends to "bottomed out" before the recession officially starts.
Factoring in total value spent on COEs
As mentioned, there is a limited number of COEs for each auction cycle. Hence, a price hike can potentially be due to a low supply of COEs. To even that out, I also analyzed charts based on the concept of total value spent on COEs. This is basically the total number of successful bids multiply by the price of COE for that period. However, I only managed to get data of total number of successful bids from 2003 onwards. Which is bad because we only have one recession to take reference from. In any case, here are the chart.
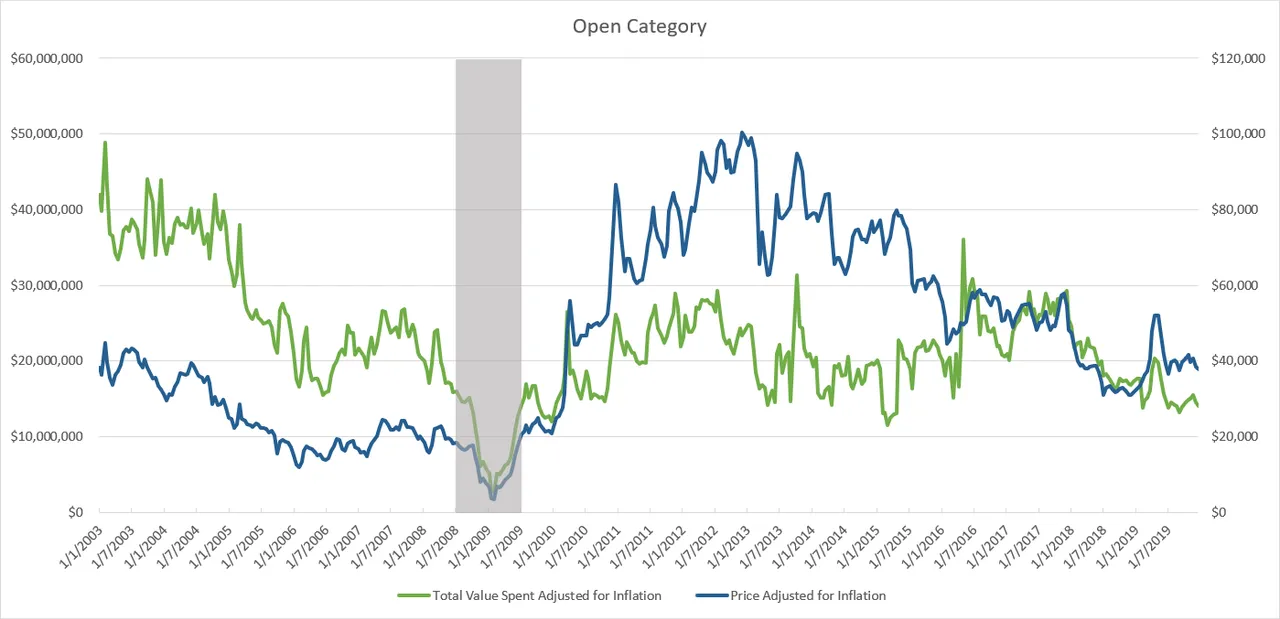
The green line represent the total value spent for "Open" category COEs and the blue line is the price. Both are adjusted for inflation. And as usual, the grey area represents recession period.
This chart tells a similar story to the previous "Open" category chart purely based on price. What is interesting from this chart is that the total value spent had remained relatively stable at $20mil after the recent recession while price had shot up to quite a high level for a while. At its peak, the price was at $100k! Which absolutely baffles me. Why will people be willing to spend so much for a car?
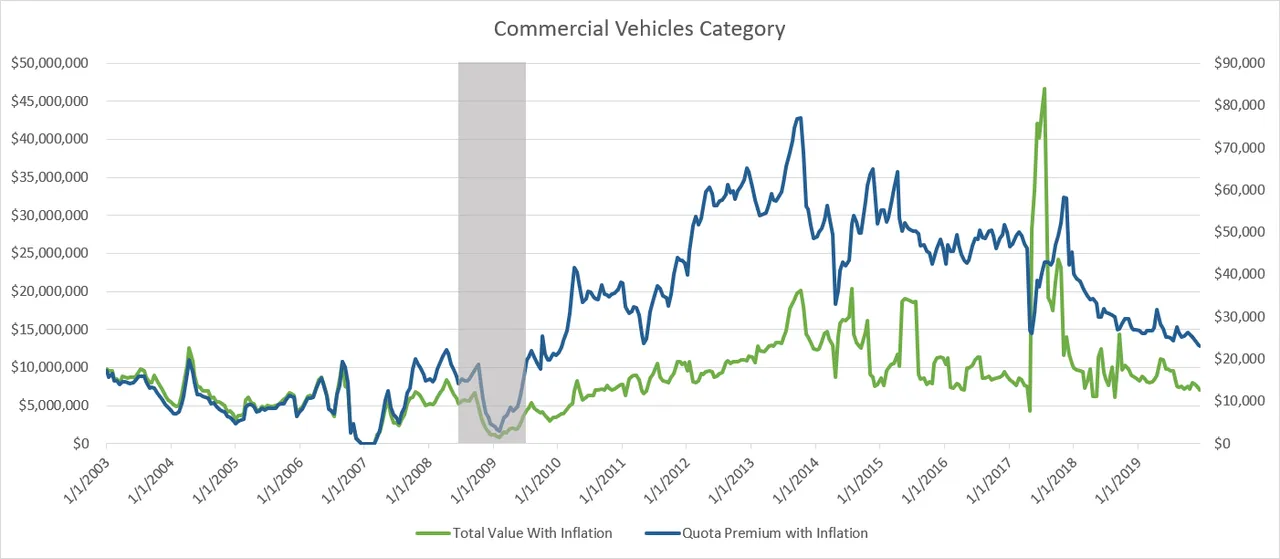
In the chart for the "Commericial" vehicles category, the narrative is also similar. However, I noticed a sudden spike in total value in 2017 which I cannot attribute to any reason.
Comparing the 2 charts, it seems that the total value spent for "Open" category is on a downtrend, while the commercial vehicle is quite stable (except for that spike in 2017). My guess is that Singapore's public transport has been improving and there is fewer reasons to own a car as time goes by. On the other hand, commercial vehicles are still required and the demand remains stable.
Conclusion
A sustained period of COE price declined seems to be a leading indicator for a recession. This is especially so for "Open" category COEs. However, "Open" category COEs bottoms during a recession while commercial vehicles COEs bottoms before a recession technically starts. This might be useful information if you are considering to buy a car in Singapore. The best time to buy is when recession officially hits 😜.
Judging from the downtrend in price since 2013, it may indicate that a recession is incoming. Of course nobody can predict exactly when that will happen, however it is always good to be prepared. I will also like to add that this analysis is far from perfect. There are many other factors that have not been considered, for example, auto-loans interest rates and the growth of Singapore's public transport, particularly the massive increase MRT lines/stations. All these other factors will affect demand and thus the price.
10% of post rewards goes to @ph-fund and 5% goes to @leo.voter to support these amazing projects.

This article is created on the Steem blockchain. Check this series of posts to learn more about writing on an immutable and censorship-resistant content platform:
- What is Steem? - My Interpretation
- Steem Thoughts - Traditional Apps vs Steem Apps
- Steem Thoughts - A Fat or Thin Protocol?
- Steem Thoughts - There is Inequitable Value Between Users and Apps
- Make my votes count! Use Dustsweeper!
- What caused STEEM to get dumped? Why I think the worst might be over
- Steem 2020 is about having a "SMART U"