
LEO is an important project for me, even though I'm not one of the whales.
I like the work done by the team and decided to start a weekly report where I compile the tokenomics of the different LEO VERSE tokens.
Why weekly and not daily?
Because I think a daily post about this, it will be like spam.
This week, as it was the first week I started collecting the data, we haven't yet been able to make comparisons, but in the coming weeks it will be possible.
LEO
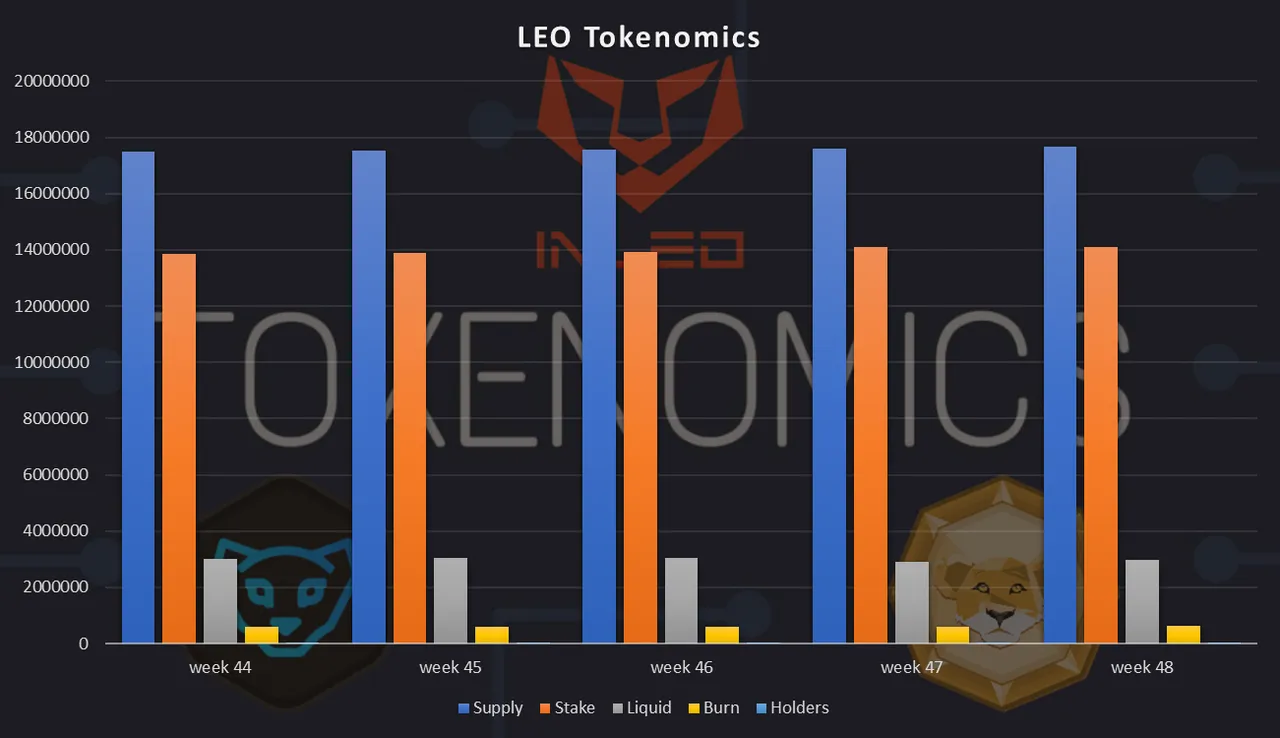
| Supply | Stake | Liquid | Burn | Holders | |
|---|---|---|---|---|---|
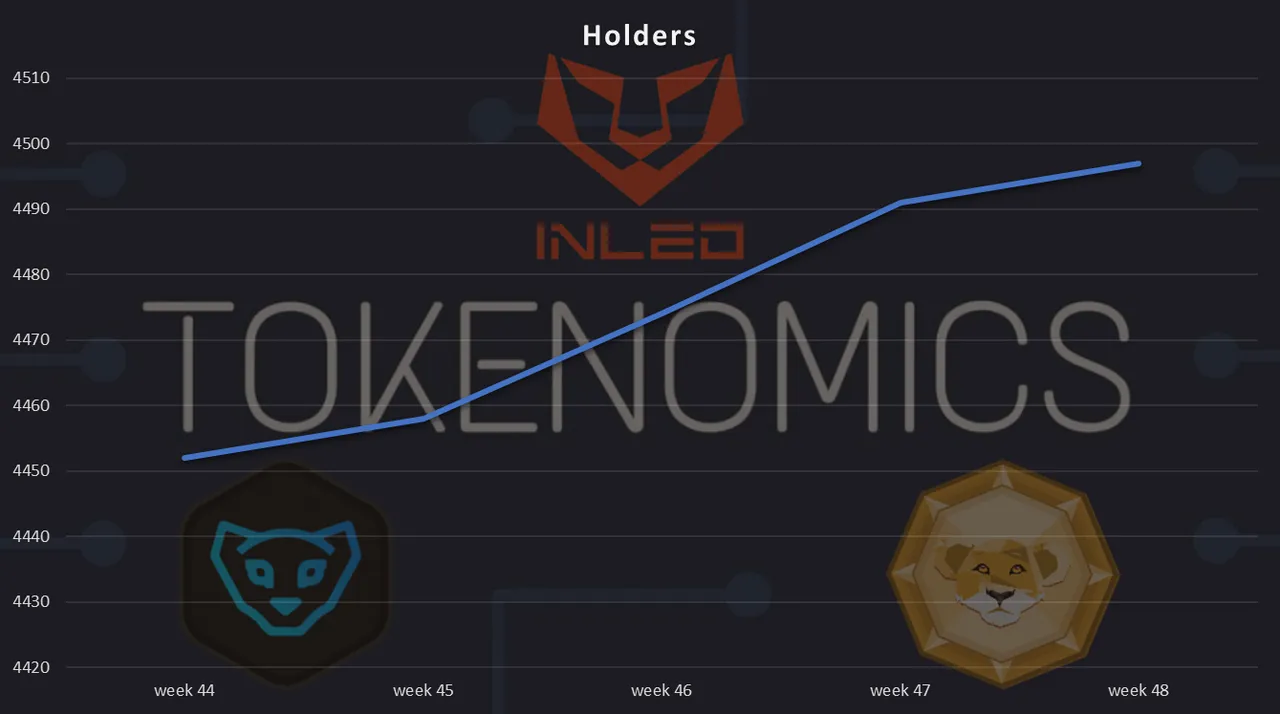
| week 44 | 17479981.689 | 13860487.378 | 3007165.979 | 612328.332 | 4452 |
| week 45 | 17527016.416 | 13880019.060 | 3034523.514 | 612470.842 | 4458 |
| week 46 | 17571133.833 | 13914478.608 | 3044061.144 | 612594.081 | 4474 |
| week 47 | 17610786.559 | 14102829.171 | 2895234.505 | 612722.883 | 4491 |
| week 48 | 17656446.768 | 14086343.430 | 2957231.223 | 612872.115 | 4497 |
Comparing with the previous week, our supply increased 45660.2 LEO, -16485.7 less LEO staked, more 61996.718 LEO liquid, more 149.232 LEO burned and 6 new holders.
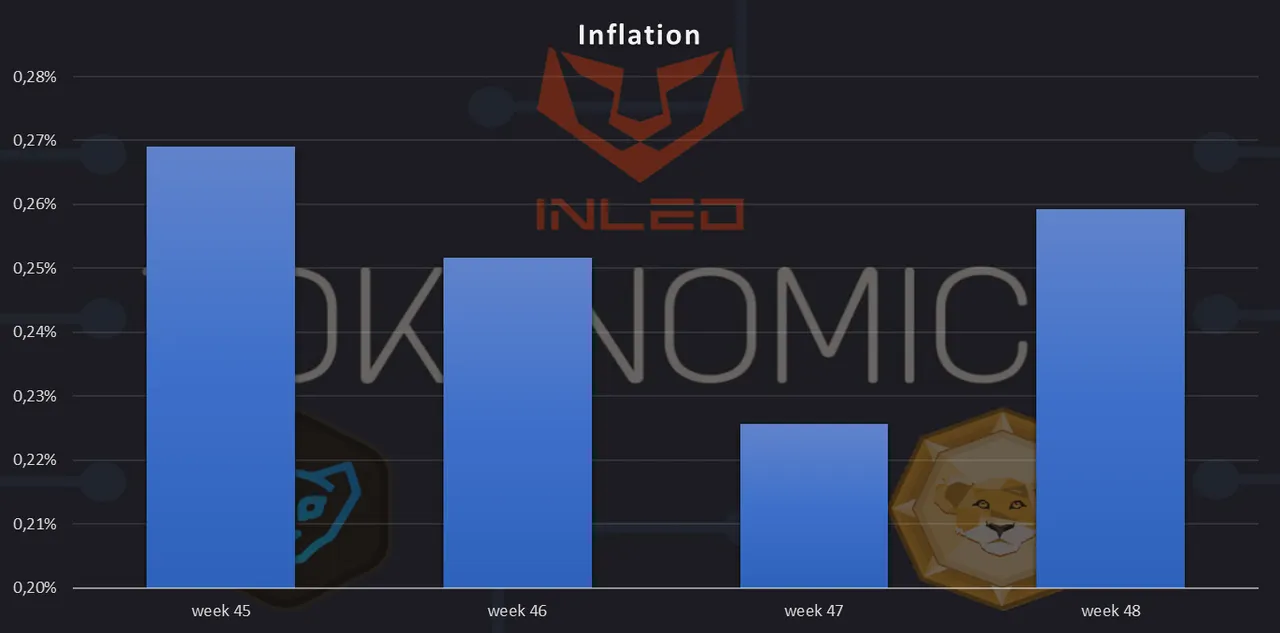
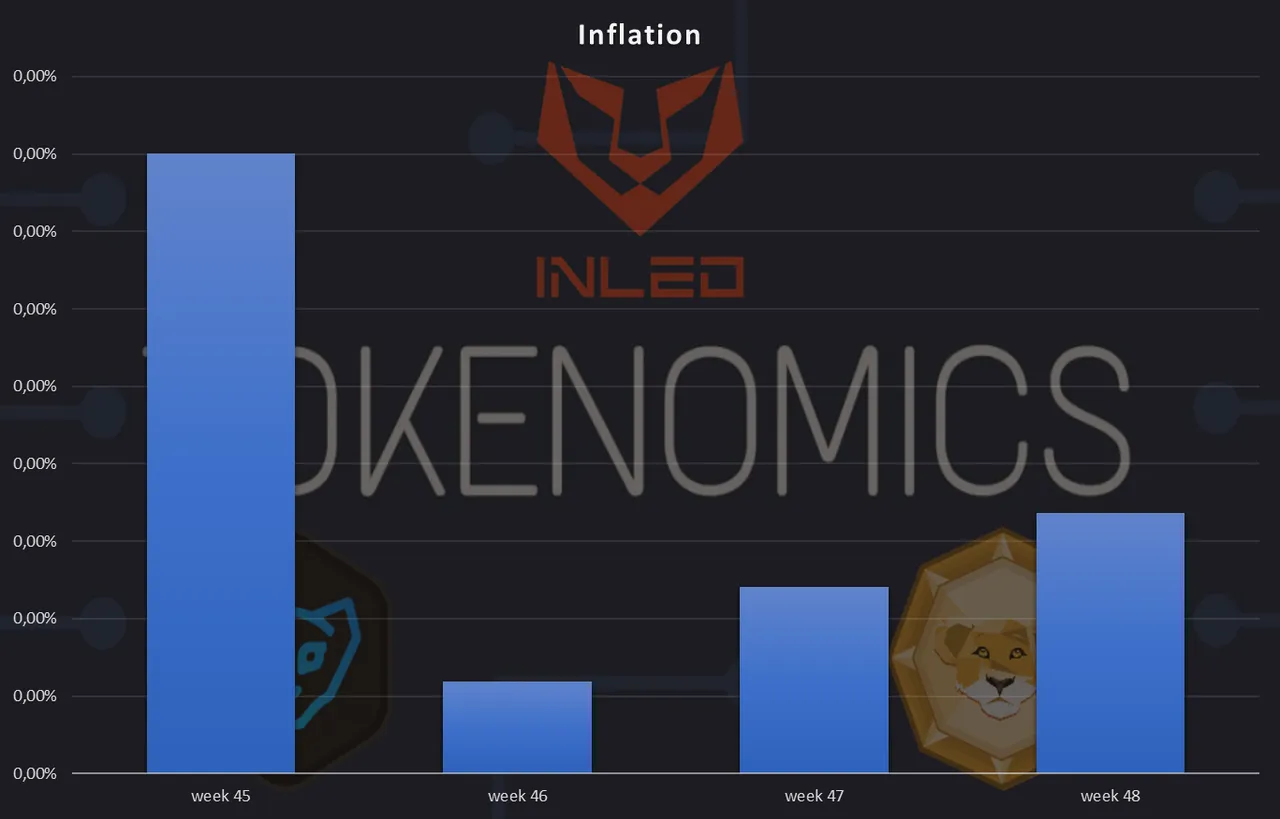
| Inflation | |
|---|---|
| week 45 | 0.27% |
| week 46 | 0.25% |
| week 47 | 0.23% |
| week 48 | 0.26% |
| Supply | Stake | Liquid | Burn | Holders | |
|---|---|---|---|---|---|
| week 45 | 0.27% | 0.14% | 0.91% | 0.02% | 0.13% |
| week 46 | 0.25% | 0.25% | 0.31% | 0.02% | 0.36% |
| week 47 | 0.23% | 1.35% | -4.98% | 0.02% | 0.38% |
| week 48 | 0.26% | -0.12% | 2.14% | 0.02% | 0.13% |
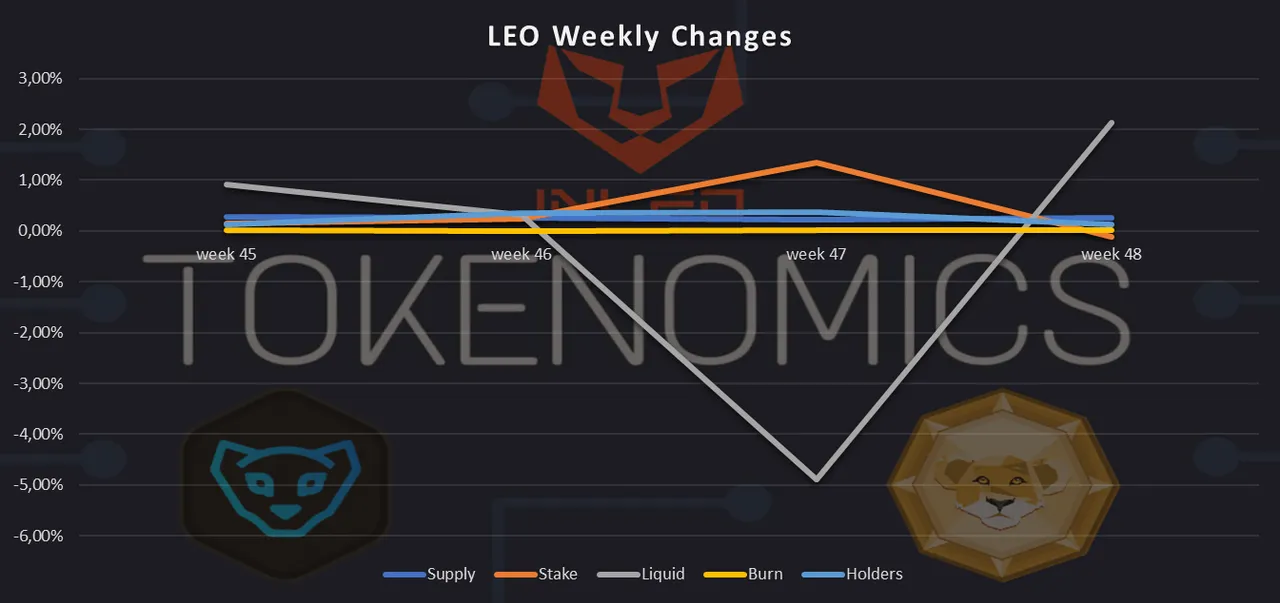
This means our supply increased 0.26%, the LEO staked decreased -0.12%, the liquid LEO increased 2.14%, LEO burned increased 0.02% and holders increased 0.13%.
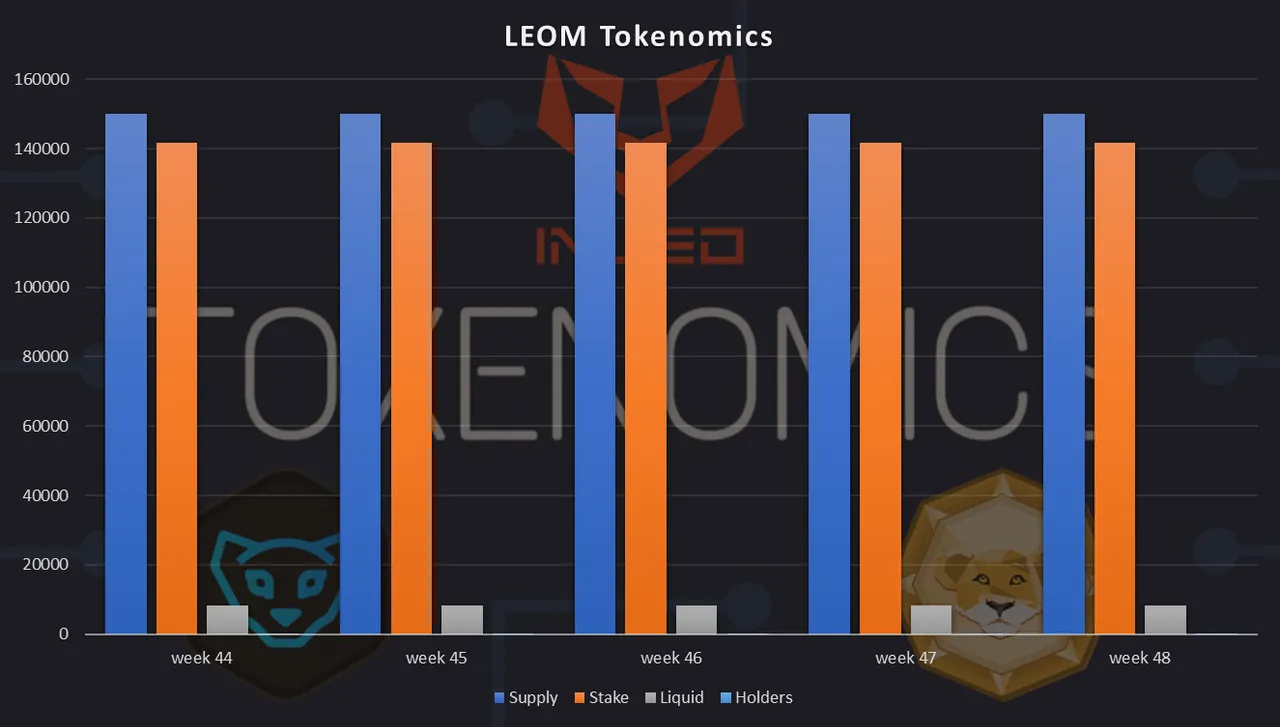
LEOM
| Supply | Stake | Liquid | Burn | Holders | |
|---|---|---|---|---|---|
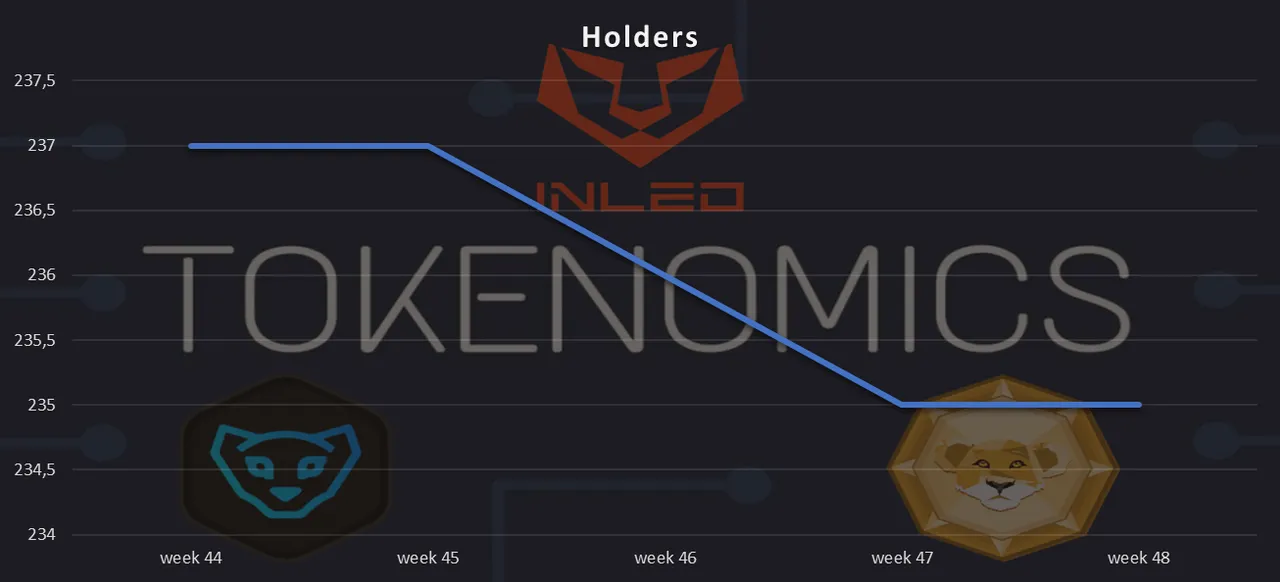
| week 44 | 149999.590 | 141762.775 | 8236.815 | 0 | 237 |
| week 45 | 149999.590 | 141757.919 | 8241.671 | 0 | 237 |
| week 46 | 149999.590 | 141750.562 | 8249.028 | 0 | 236 |
| week 47 | 149999.590 | 141742.482 | 8257.108 | 0 | 235 |
| week 48 | 149999.590 | 141673.136 | 8326.454 | 0 | 235 |
Comparing with the previous week, less -69.346 LEOM staked and more 69.346 LEOM liquid.
| Supply | Stake | Liquid | Holders | |
|---|---|---|---|---|
| week 45 | 0% | -0.003% | 0.06% | 0% |
| week 46 | 0% | -0.01% | 0.09% | -0.42% |
| week 47 | 0% | -0.01% | 0.10% | -0.42% |
| week 48 | 0% | -0.05% | 0.84% | 0% |
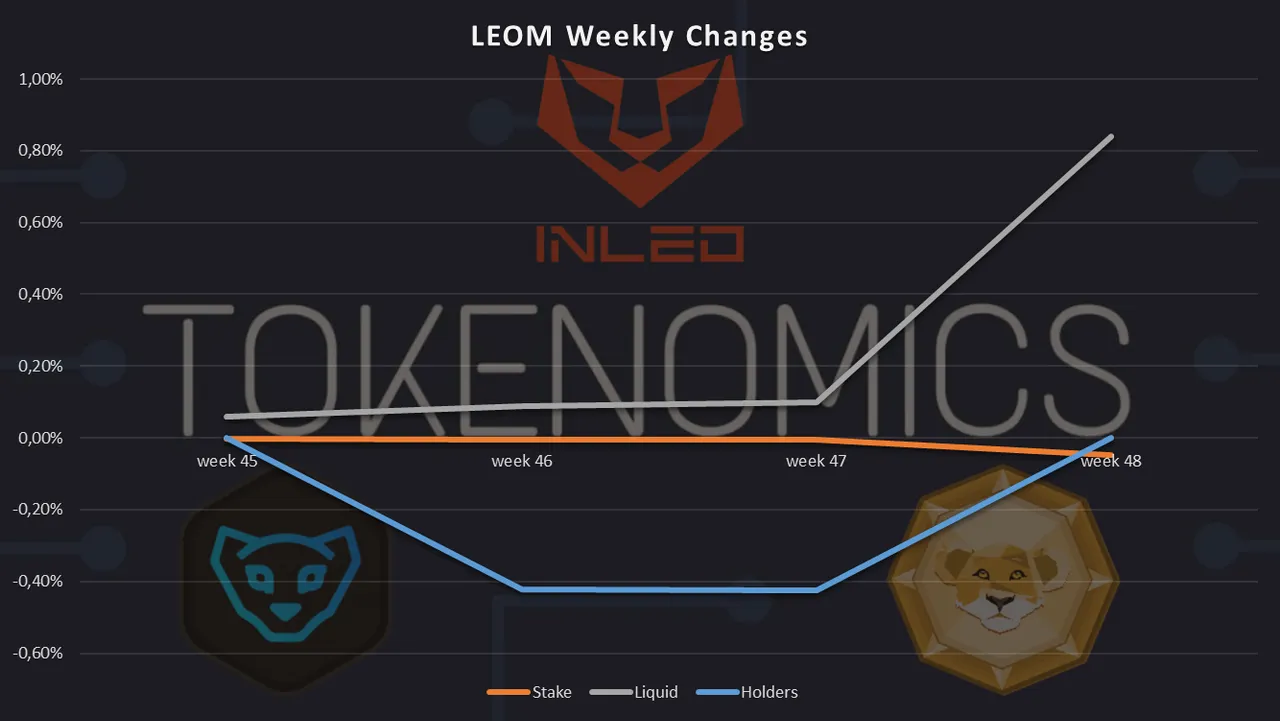
This means the LEOM staked decreased -0.05% and the liquid LEOM increased 0.84%.
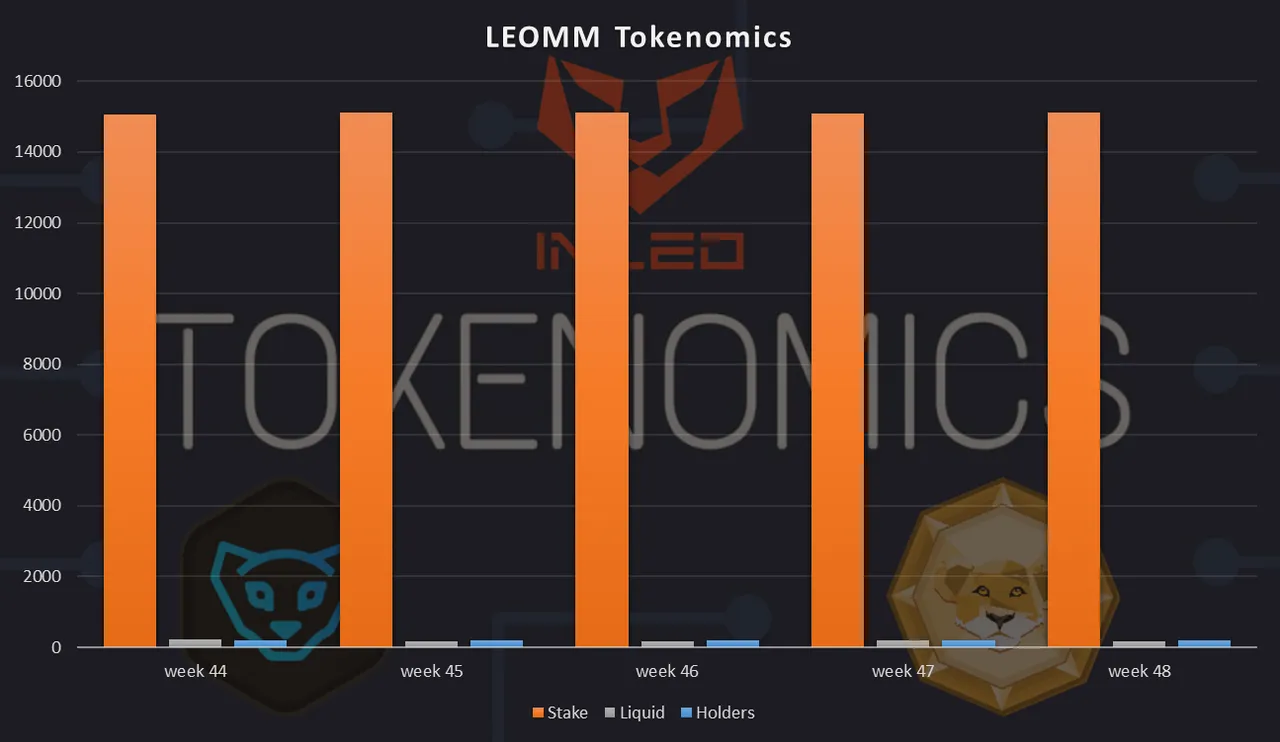
LEOMM
| Supply | Stake | Liquid | Burn | Holders | |
|---|---|---|---|---|---|
| week 44 | 15284.795 | 15059.351 | 225.444 | 0 | 205 |
| week 45 | 15284.795 | 15127.704 | 157.091 | 0 | 205 |
| week 46 | 15284.795 | 15111.134 | 173.661 | 0 | 205 |
| week 47 | 15284.795 | 15093.812 | 190.983 | 0 | 204 |
| week 48 | 15284.795 | 15117.249 | 167.546 | 0 | 204 |
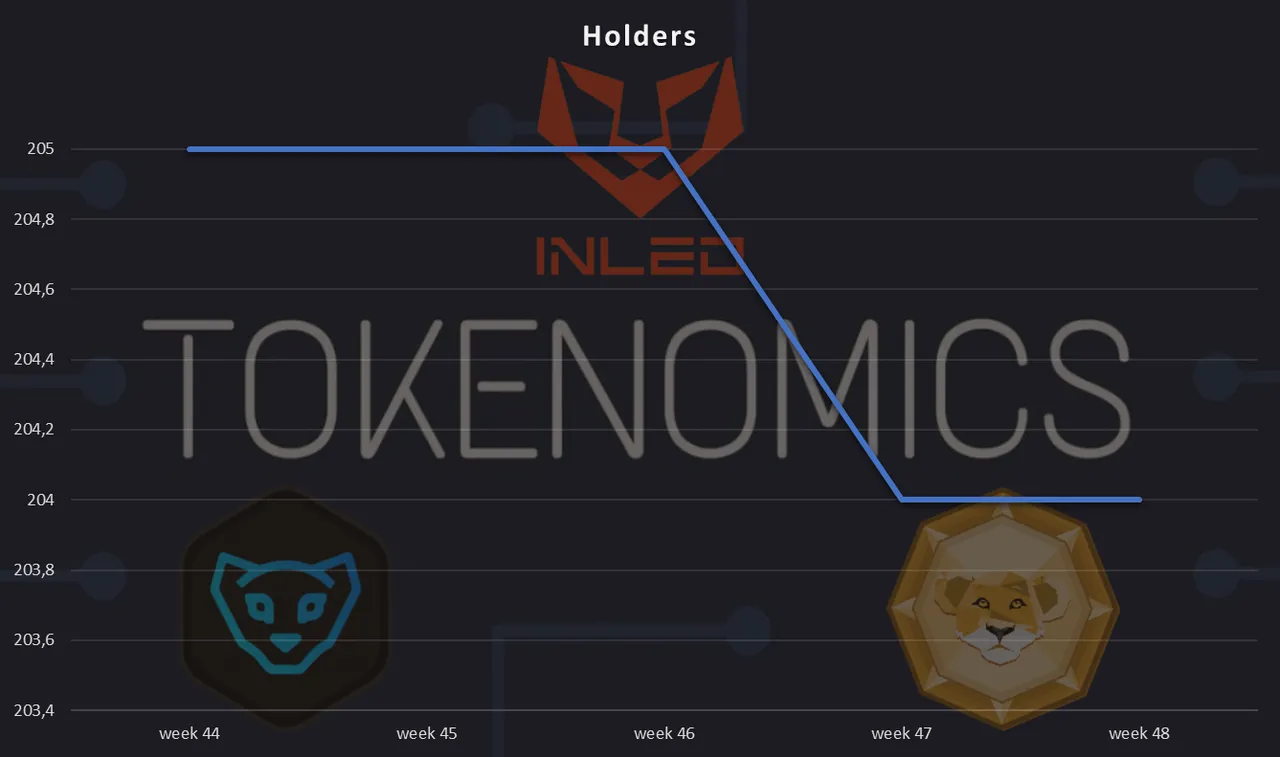
Comparing with the previous week, more 23.437 staked, less -23.437 LEOMM liquid.
| Supply | Stake | Liquid | Holders | |
|---|---|---|---|---|
| week 45 | 0% | 0.45% | -30.32% | 0% |
| week 46 | 0% | -0.11% | 10.55% | 0% |
| week 47 | 0% | -0.11% | 9.97% | -0.49% |
| week 48 | 0% | 0.16% | -12.27% | 0% |
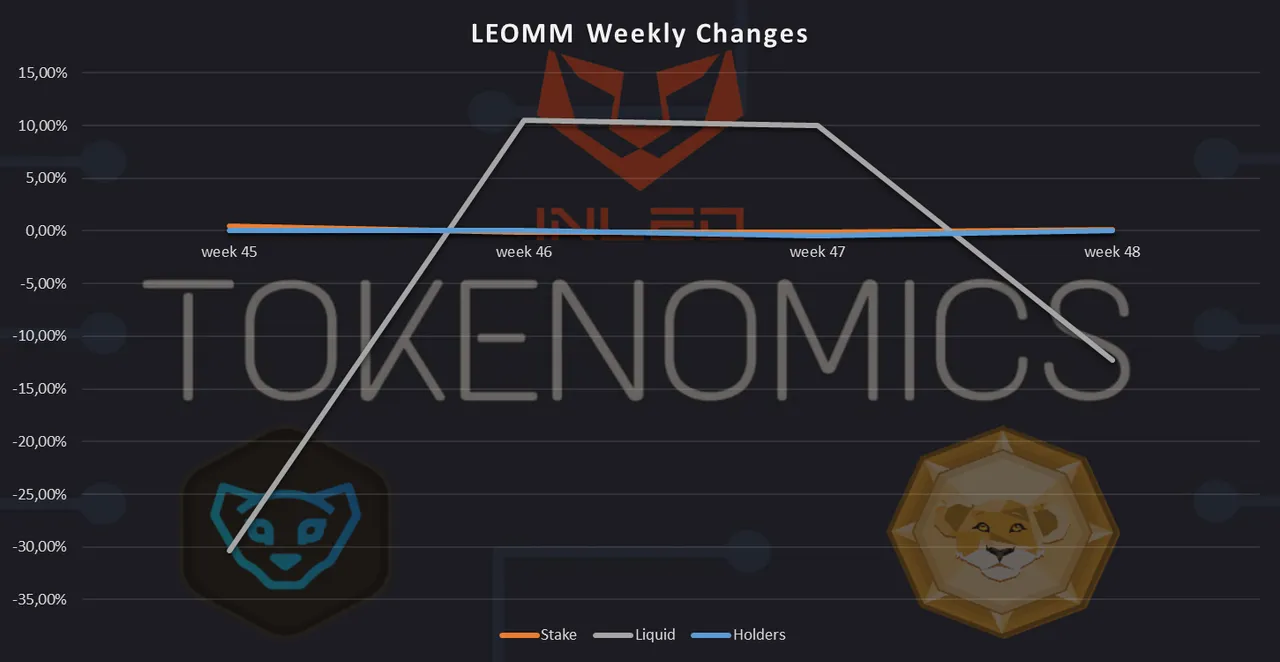
This means the LEOMM staked incresead 0.16% and the liquid LEOMM decresead -12.27%.
CUB
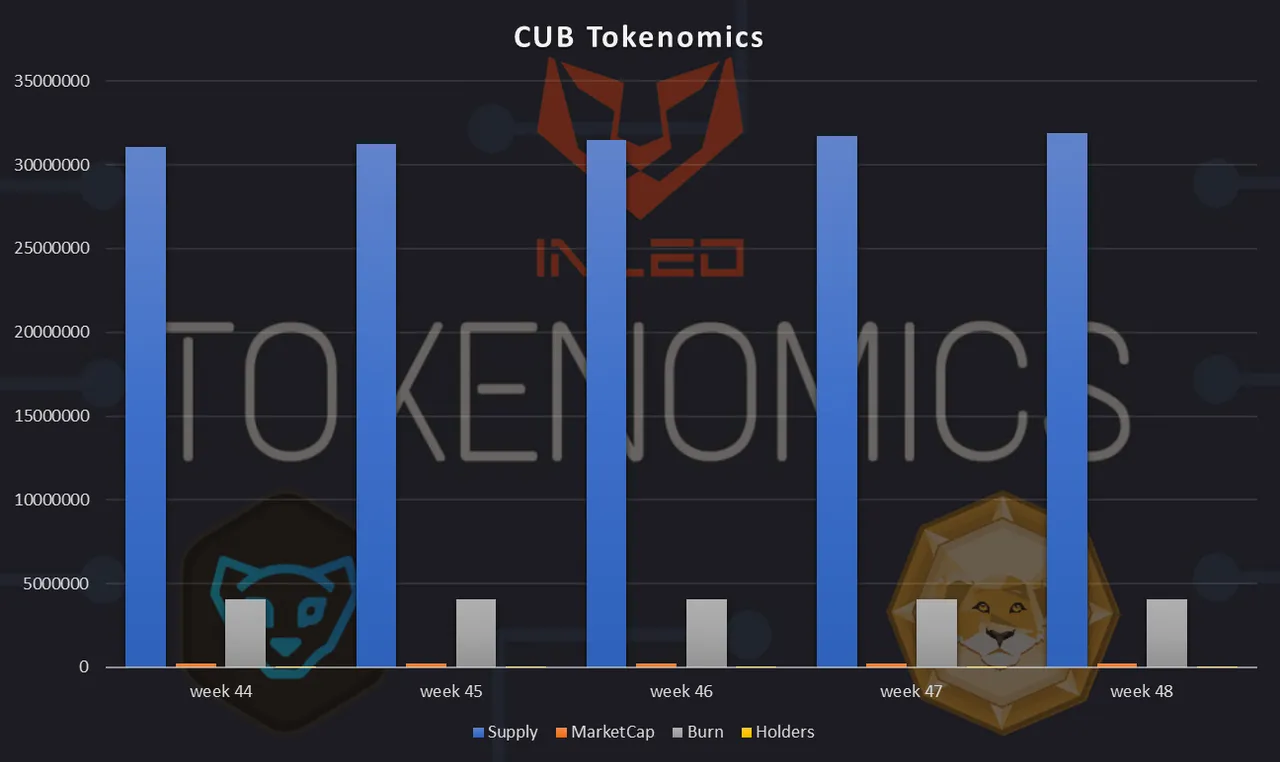
| Supply | MarketCap | Burn | Holders | |
|---|---|---|---|---|
| week 44 | 31084965.456 | 203.968 | 4073145.151 | 1530 |
| week 45 | 31258197.433 | 207.725 | 4073145.151 | 1531 |
| week 46 | 31484041.091 | 213205 | 4073145.151 | 1530 |
| week 47 | 31696217.329 | 206833 | 4073145.151 | 1534 |
| week 48 | 31876821.605 | 204546 | 4073145.151 | 1540 |
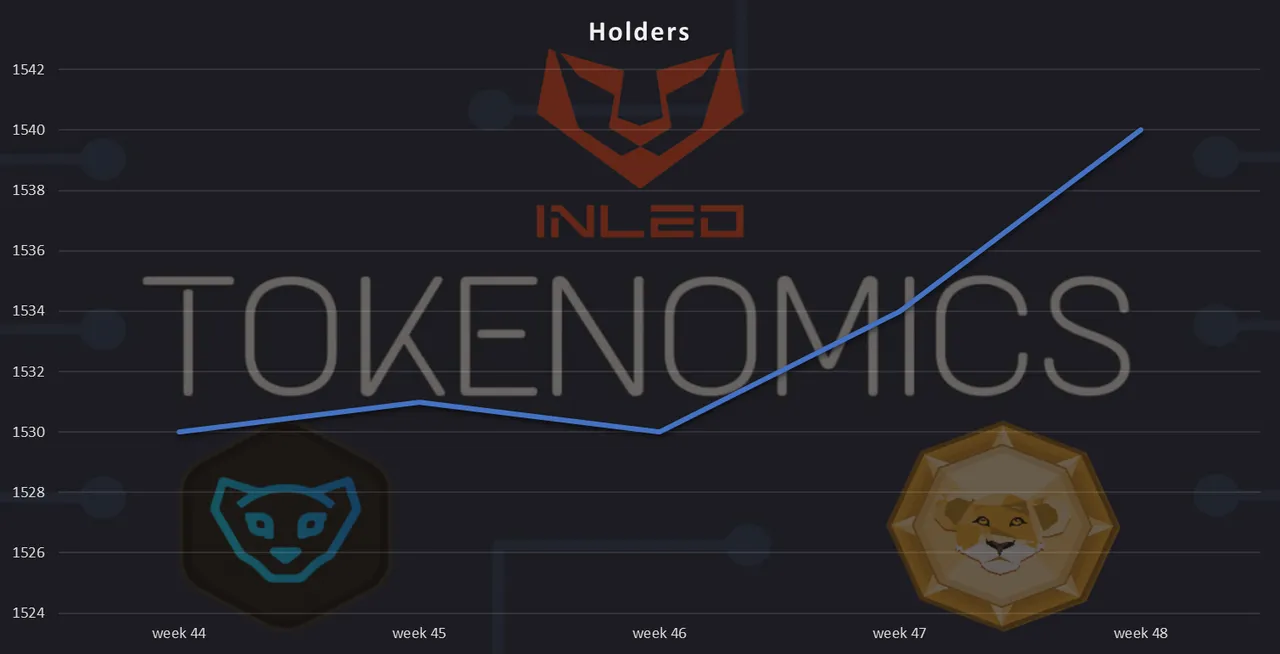
Comparing with the previous week, our supply increased 180604 CUB, the market cap decreased -2287 and more 6 holders.
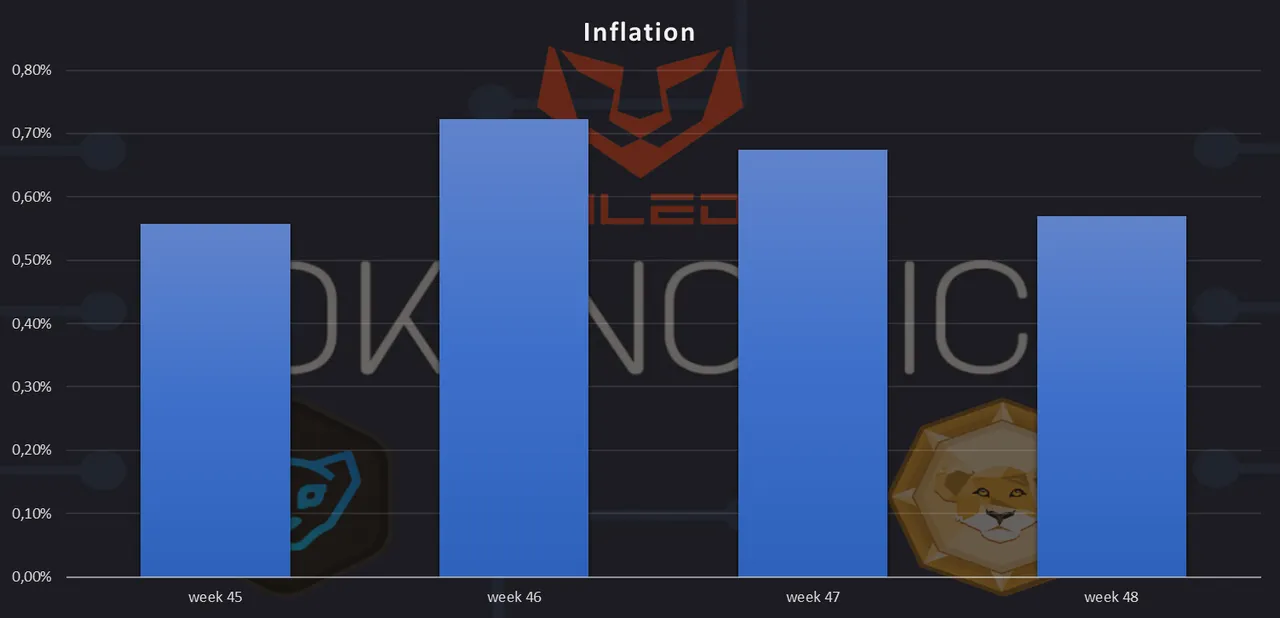
| Inflation | |
|---|---|
| week 45 | 0.56% |
| week 46 | 0.72% |
| week 47 | 0.67% |
| week 48 | 0.57% |
| Supply | MarketCap | Burn | Holders | |
|---|---|---|---|---|
| week 45 | 0.56% | 1.84% | 0% | 0.07% |
| week 46 | 0.72% | 2.64% | 0% | -0.07% |
| week 47 | 0.67% | -2.99% | 0% | 0.26% |
| week 48 | 0.57% | -1.11% | 0% | 0.39% |
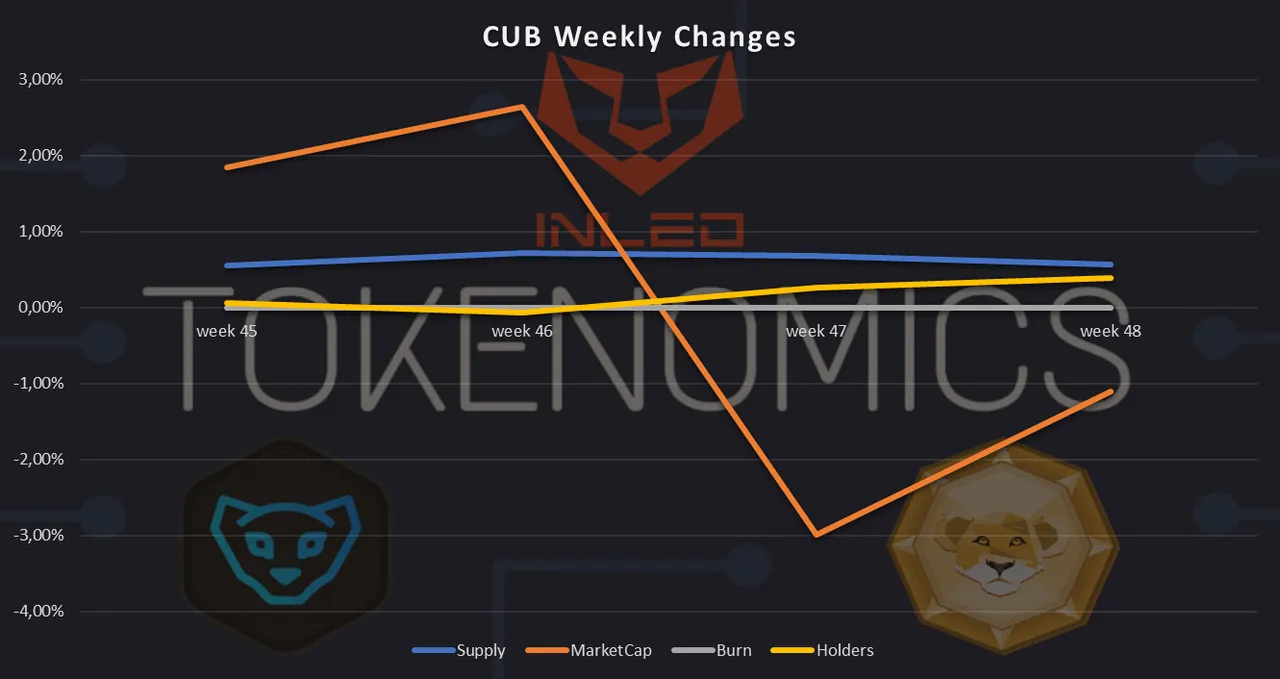
This means our supply increased 0.57%, the CUB marketCap decreased -1.11% and holders increased 0.39%.
POLYCUB
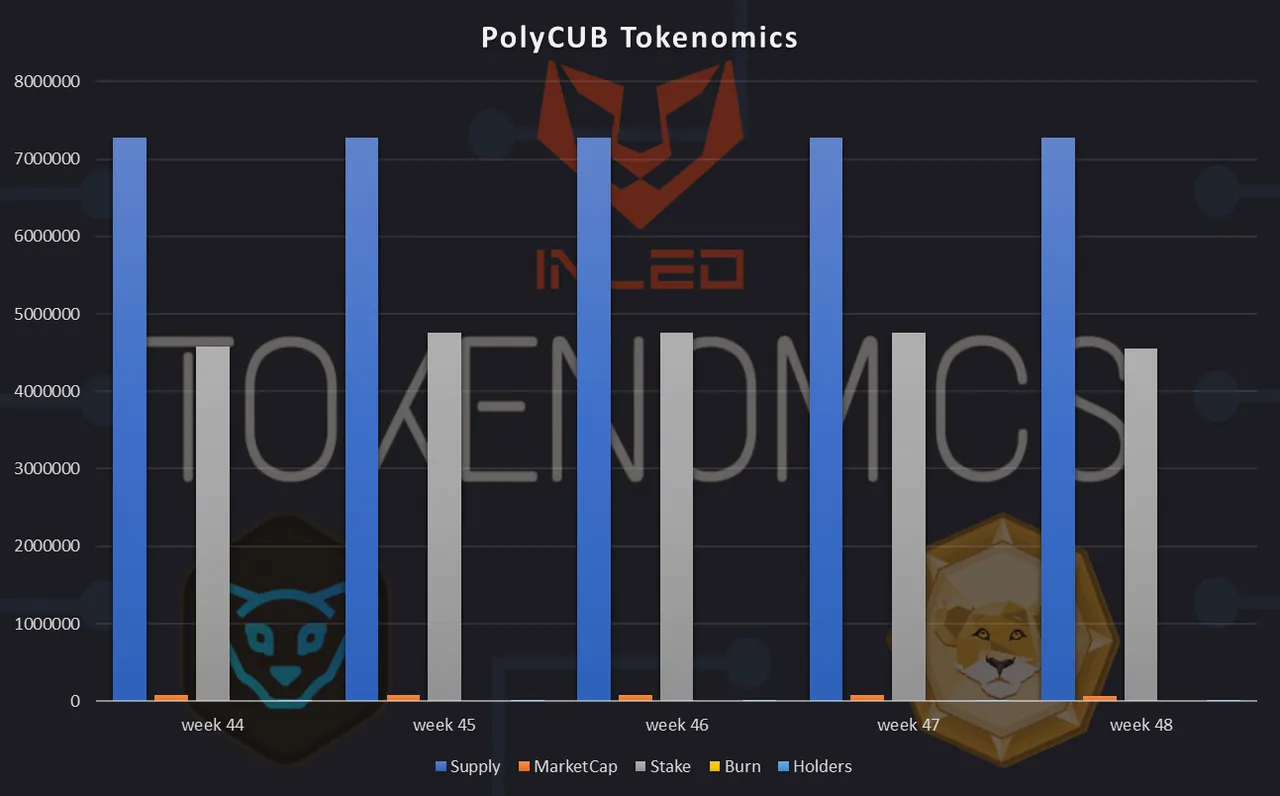
| Supply | MarketCap | Stake | Burn | Holders | |
|---|---|---|---|---|---|
| week 44 | 772490.406 | 82236 | 4575696.05 | 0 | 725 |
| week 45 | 7724302.061 | 82110 | 47353586.040 | 0 | 723 |
| week 46 | 7274303.783 | 81193 | 47353586.040 | 0 | 723 |
| week 47 | 7274307.297 | 80440 | 4751929.623 | 0 | 727 |
| week 48 | 7274312.187 | 66600 | 4557327.070 | 0 | 732 |
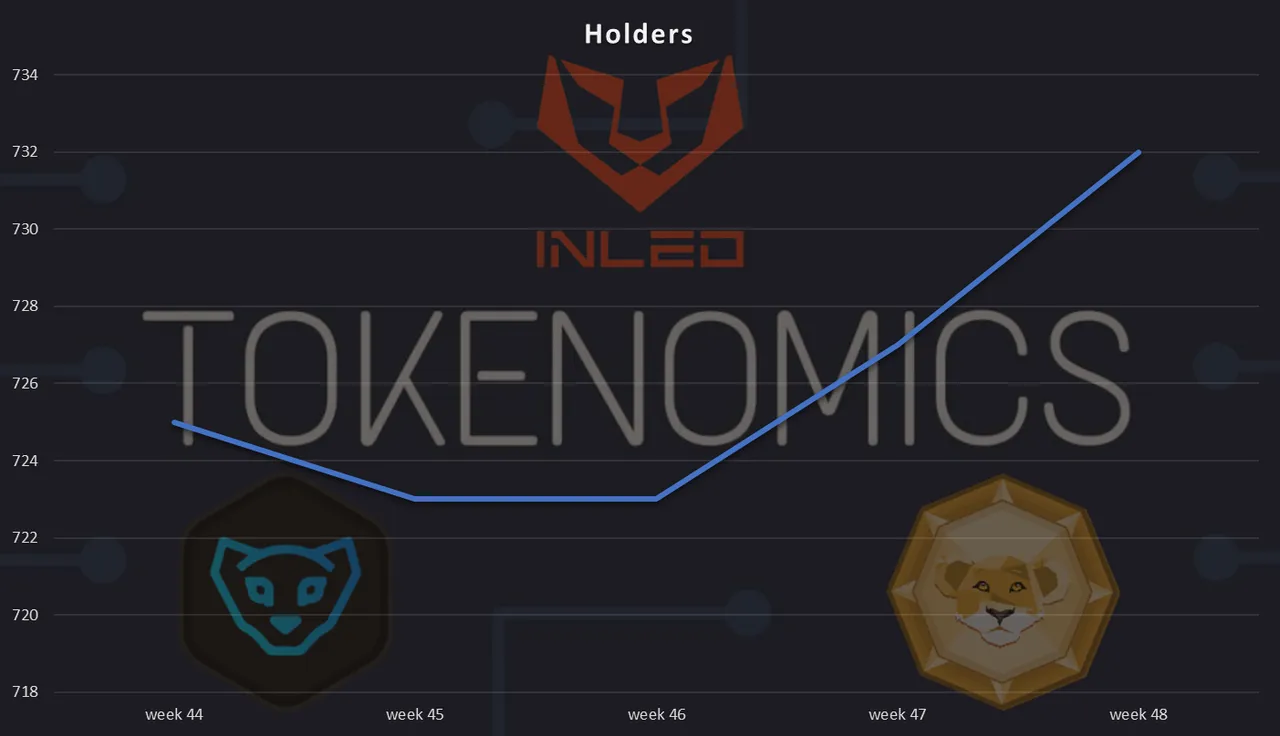
Comparing with the previous week, our supply increased 4.89033 PolyCub, the marcketcap decreased -13840, stake decreased -194603 PolyCub and holders increased 5.
| Inflation | |
|---|---|
| week 45 | 0.0002% |
| week 46 | 0.00002% |
| week 47 | 0.00005% |
| week 48 | 0.0001% |
| Supply | MarketCap | Stake | Burn | Holders | |
|---|---|---|---|---|---|
| week 45 | 0.0002% | -0.15% | 3.888% | 0% | -0.28% |
| week 46 | 0.00002% | -1.12% | 0% | 0% | 0% |
| week 47 | 0.00005% | -0.93% | -0.035% | 0% | 0.55% |
| week 48 | 0.0001% | -17.21% | -4.095% | 0% | 0.69% |
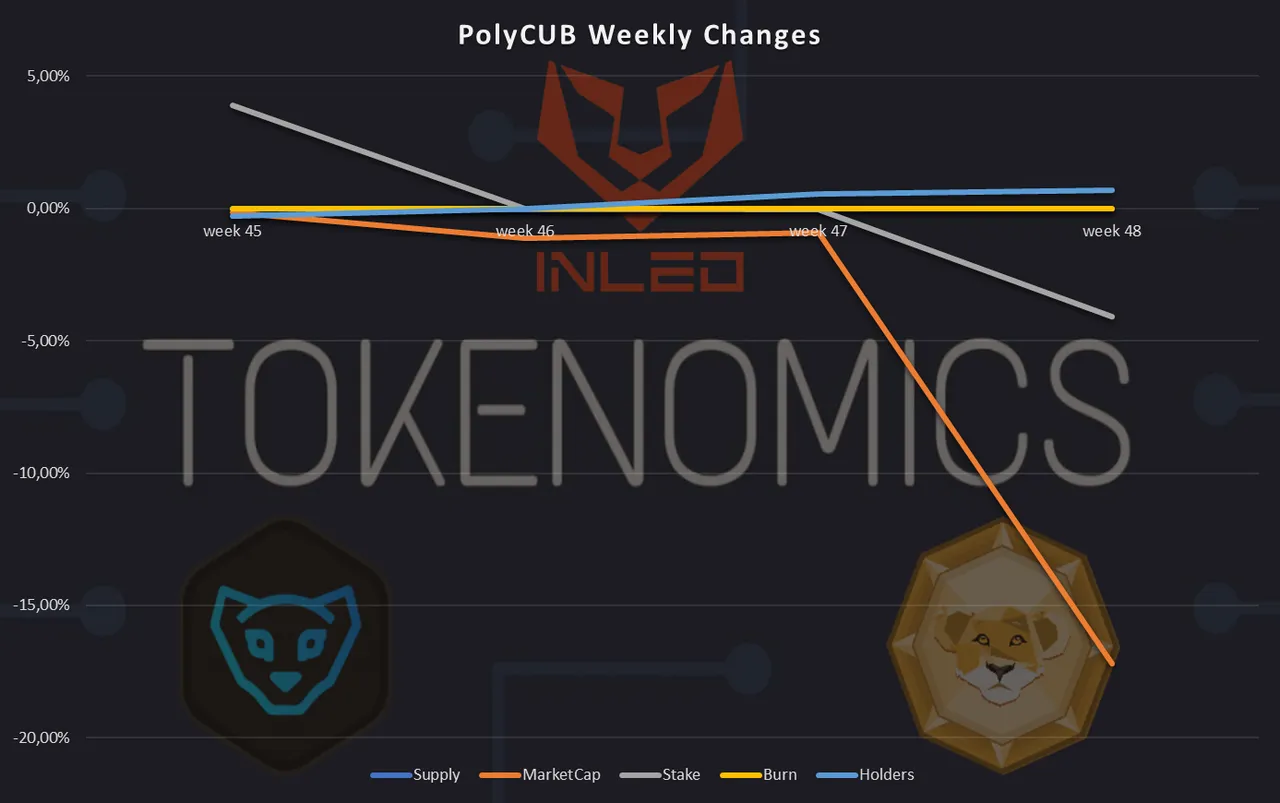
This means our supply increased 0.0001%, MarketCap decreased -17.21% and holders increased 0.69%.