@raymondspeaks and @silverstackeruk launched a new project called @dailydab.
I decided to create a weekly report to follow the development of the tokenomics of both tokens (DBOND and DAB).
Why weekly and not daily?
Because I think a daily post about this, it will be like spam.
To know more about the project, check this link
DBOND
DBOND it is the DAB miner.
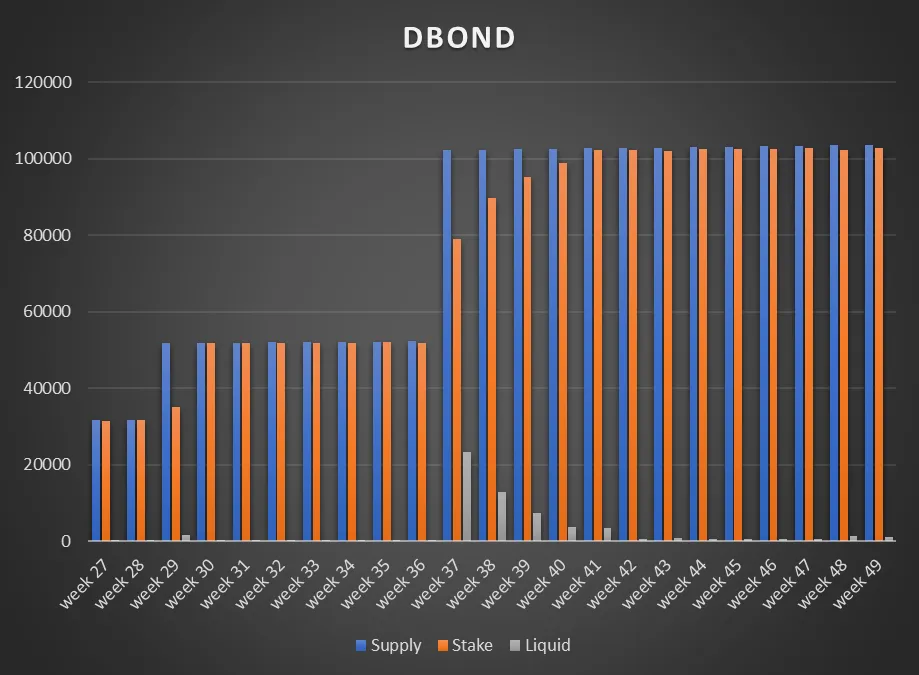
| Supply | Stake | Liquid | |
|---|---|---|---|
| week 27 | 31623.29 | 31466.81 | 156.4835 |
| week 28 | 31687.41 | 31564.8 | 122.6123 |
| week 29 | 51777.92 | 34989.09 | 16788.83 |
| week 30 | 51860.063 | 51742.44457 | 117.6184 |
| week 31 | 51919.163 | 51818.4455107 | 100.7175 |
| week 32 | 51995.993 | 51893.4611 | 102.5319 |
| week 33 | 52060.103 | 51739.92785465 | 320.17514536 |
| week 34 | 52122.51 | 51900.19311 | 222.32 |
| week 35 | 52176.57 | 51971.4116 | 205.161 |
| week 36 | 52220.373 | 51825.62283 | 394.7501662 |
| week 37 | 102308.883 | 78981.16405 | 23327.71895 |
| week 38 | 102377.453 | 89654.68392 | 12722.76908 |
| week 39 | 102484.793 | 95261.40214 | 7223.390864 |
| week 40 | 102598.743 | 98856.79856 | 3741.944443 |
| week 41 | 102718.173 | 102324.9698 | 3393.203152 |
| week 42 | 102821.133 | 102321.036 | 509.0970305 |
| week 43 | 102944.353 | 102134.5709 | 809.7820651 |
| week 44 | 103050.443 | 102561.093 | 489.3400425 |
| week 45 | 103189.413 | 102646.2961 | 543.1213914 |
| week 46 | 103282.893 | 102667.6571 | 615.2359044 |
| week 47 | 103410.053 | 102810.4649 | 599.5880949 |
| week 48 | 103521.443 | 102246.3097 | 1276.133376 |
| week 49 | 103635.28 | 102698.1057 | 937.177254 |
Comparing with the previous week, we have 113.84 increased in supply, DBOND staked increased 451.7961 and less -337.956 DBOND liquid.
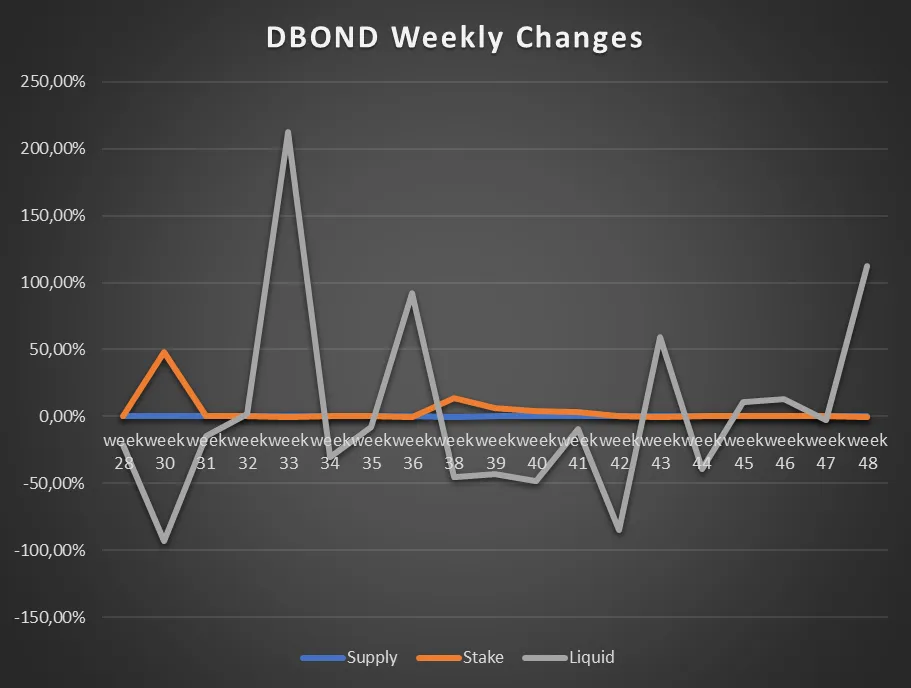
I decided to not put week 37 because the chart will be very difficult to read.
This means our supply increased 0.11%, the DBOND staked increased 0.44% and the liquid DBOND decreased -26.5%.
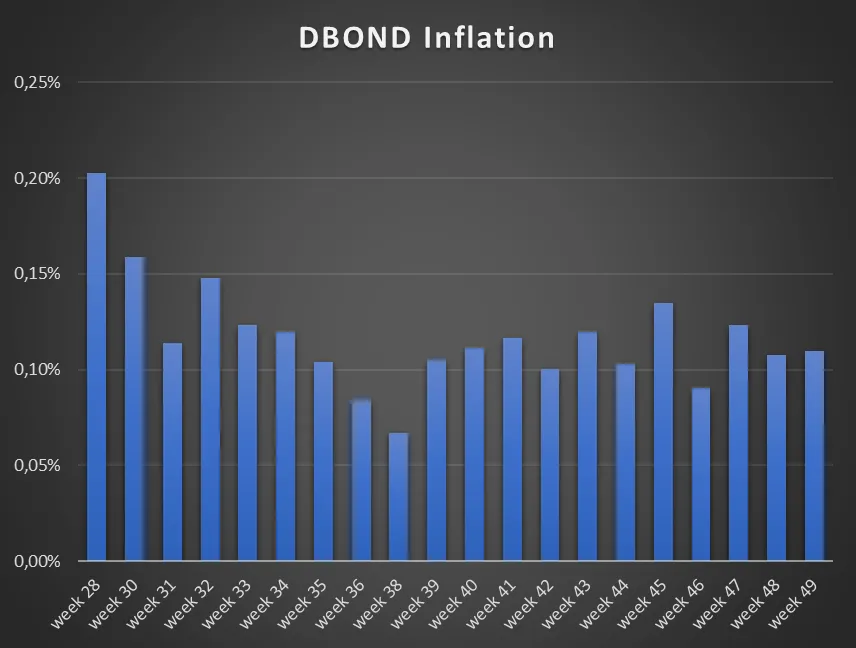
| DBOND Inflation | |
|---|---|
| week 28 | 0.20% |
| week 29 | 63.40% |
| week 30 | 0.16% |
| week 31 | 0.11% |
| week 32 | 0.15% |
| week 33 | 0.12% |
| week 34 | 0.12% |
| week 35 | 0.10% |
| week 36 | 0.08% |
| week 37 | 95.92% |
| week 38 | 0.07% |
| week 39 | 0.10% |
| week 40 | 0.11% |
| week 41 | 0.12% |
| week 42 | 0.10% |
| week 43 | 0.12% |
| week 44 | 0.10% |
| wwek 45 | 0.13% |
| week 46 | 0.09% |
| week 47 | 0.12% |
| week 48 | 0.11% |
| week 49 | 0.11% |
At this point, the average DBOND Inflation is 0.12%. I removed the week 29 and week 37 from the calculation since that DBOND were not generated trough DAB stake but were related to a new public sale release.
DAB
Let's see what DAB holders will prefer if more DBOND or continue to only receive Hive drips.
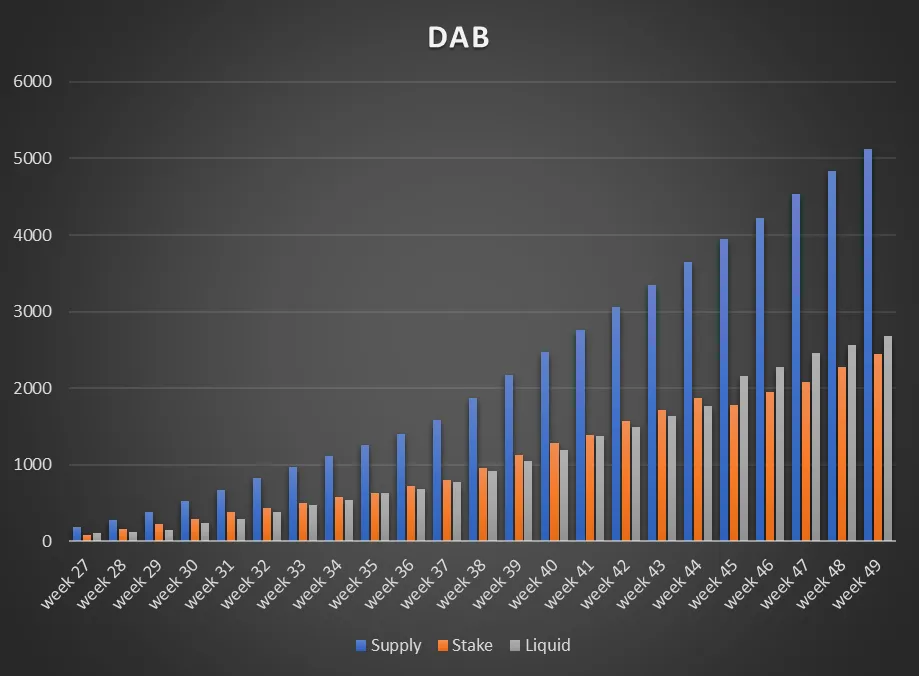
| Supply | Stake | Liquid | |
|---|---|---|---|
| week 27 | 185.76 | 76.27 | 109.49 |
| week 28 | 277.56 | 160.748 | 116.812 |
| week 29 | 379.06 | 229.001 | 150.059 |
| week 30 | 528.66 | 293.755 | 234.905 |
| week 31 | 665.06 | 375.667 | 289.393 |
| week 32 | 821.7 | 438.88 | 382.82 |
| week 33 | 972.18 | 498.182 | 473.998 |
| week 34 | 1117.38 | 583.224 | 534.156 |
| week 35 | 1258.18 | 634.786 | 623.394 |
| week 36 | 1395.46 | 715.446 | 680.014 |
| week 37 | 1577.62 | 800.538 | 777.082 |
| week 38 | 1871.54 | 955.655 | 915.885 |
| week 39 | 2170.74 | 1126.533 | 1044.207 |
| week 40 | 2466.42 | 1280.623 | 1185.797 |
| week 41 | 2758.58 | 1389.272 | 1369.308 |
| week 42 | 3054.26 | 1567.217 | 1487.043 |
| week 43 | 3351.7 | 1715.609 | 1636.091 |
| week 44 | 3642.1 | 1872.637 | 1769.463 |
| week 45 | 3946.58 | 1784.871 | 2161.709 |
| week 46 | 4221.14 | 1944.105 | 2277.035 |
| week 47 | 4536.18 | 2082.685 | 2453.495 |
| week 48 | 4836.38 | 2272.182 | 2563.198 |
| week 49 | 5129.3 | 2448.23 | 2681.07 |
Comparing with the previous week, we have 293.92 increase in supply, increased 176.048 DAB staked and more 117.872 DAB liquid.
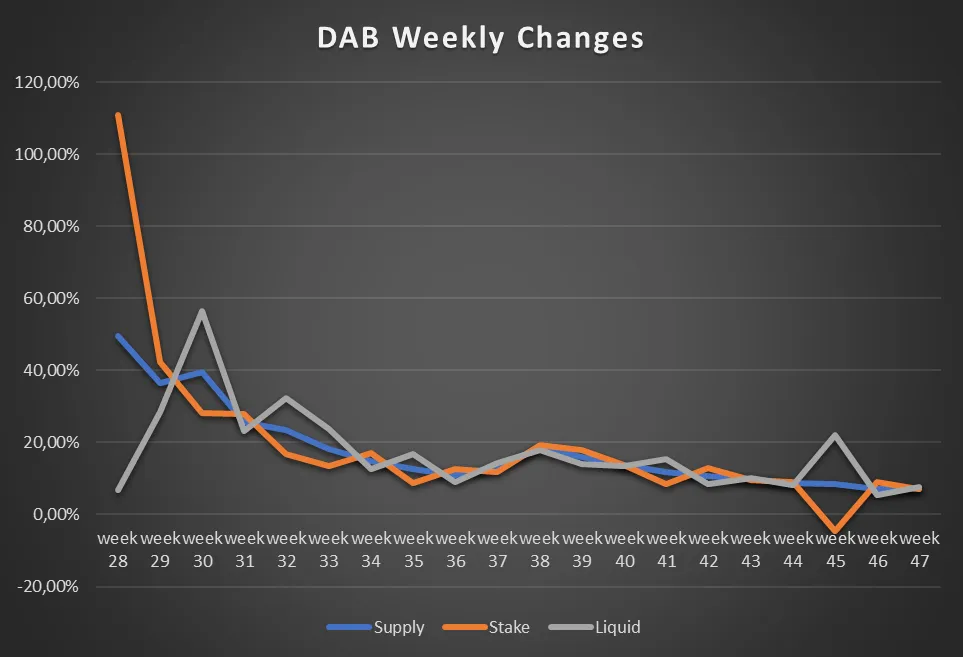
This means our supply increased 6.08%, the DAB staked increased 7.75% and the liquid DAB increased 4.6%.
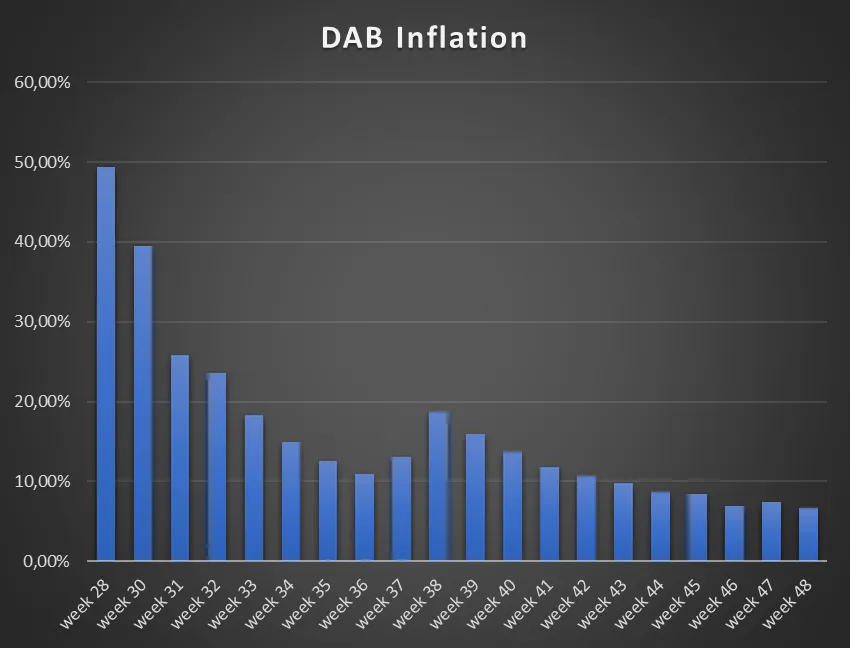
| DAB Inflation | |
|---|---|
| week 28 | 49.42% |
| week 29 | 36.57% |
| week 30 | 39.47% |
| week 31 | 25.80% |
| week 32 | 23.55% |
| week 33 | 18.31% |
| week 34 | 14.94% |
| week 35 | 12.60% |
| week 36 | 10.91% |
| week 37 | 13.05% |
| week 38 | 18.63% |
| week 39 | 15.99% |
| week 40 | 13.62% |
| week 41 | 11.85% |
| week 42 | 10.72% |
| week 43 | 9.74% |
| week 44 | 8.66% |
| week 45 | 8.36% |
| week 46 | 6.96% |
| week 47 | 7.46% |
| week 48 | 6.6% |
| week 49 | 6.08% |
At this point, the average DAB Inflation is 15.84%.