@raymondspeaks and @silverstackeruk launched a new project called @dailydab.
I decided to create a weekly report to follow the development of the tokenomics of both tokens (DBOND and DAB).
Why weekly and not daily?
Because I think a daily post about this, it will be like spam.
To know more about the project, check this link
DBOND
DBOND it is the DAB miner.
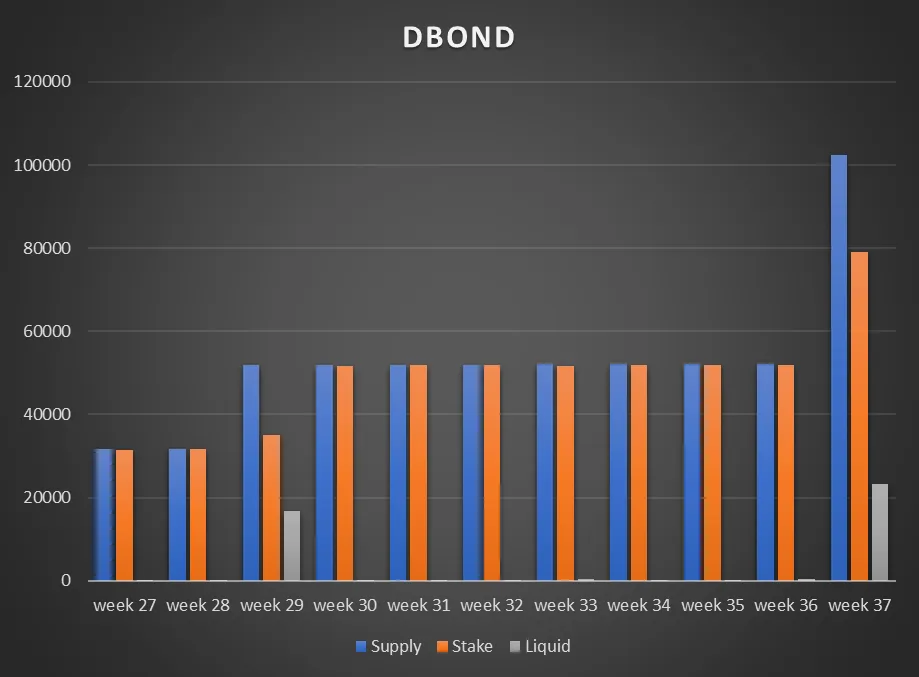
| Supply | Stake | Liquid | |
|---|---|---|---|
| week 27 | 31623.29 | 31466.81 | 156.4835 |
| week 28 | 31687.41 | 31564.8 | 122.6123 |
| week 29 | 51777.92 | 34989.09 | 16788.83 |
| week 30 | 51860.063 | 51742.44457 | 117.6184 |
| week 31 | 51919.163 | 51818.4455107 | 100.7175 |
| week 32 | 51995.993 | 51893.4611 | 102.5319 |
| week 33 | 52060.103 | 51739.92785465 | 320.17514536 |
| week 34 | 52122.51 | 51900.19311 | 222.32 |
| week 35 | 52176.57 | 51971.4116 | 205.161 |
| week 36 | 52220.373 | 51825.62283 | 394.7501662 |
| week 37 | 102308.883 | 78981.16405 | 23327.71895 |
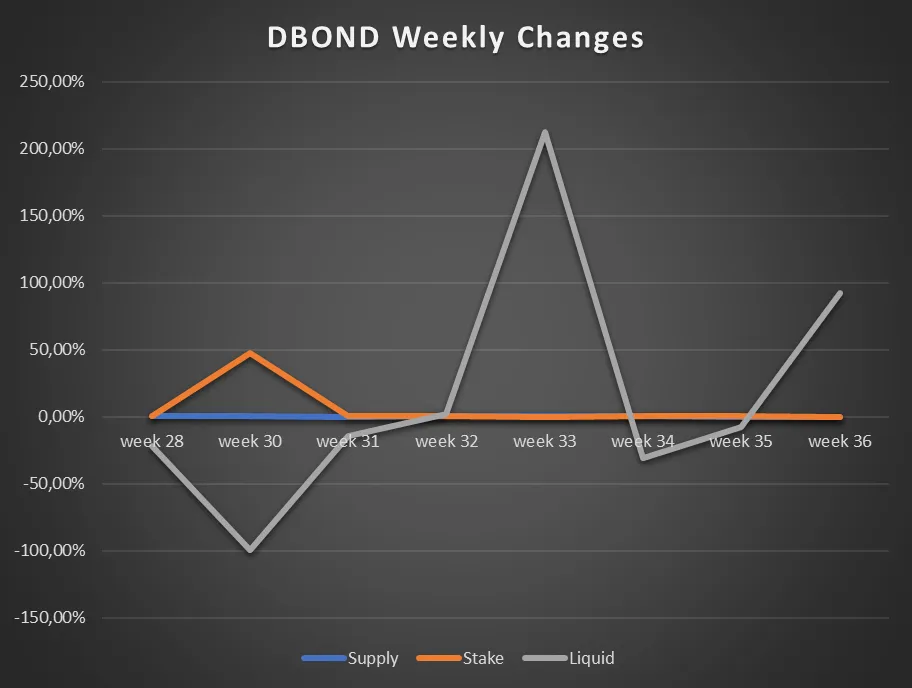
Comparing with the previous week, we have 50088.5 increase in supply, 27155.54 more DBOND staked and more 22932.97 DBOND liquid.
This abnormal increase it is related with the fact more DBOND were sold.
I decided to not put week 37 because the chart will be very difficult to read.
This means our supply increased 95.92%, the DBOND staked increased 52.40% % and the liquid DBOND increased 5809.49%.
| DBOND Inflation | |
|---|---|
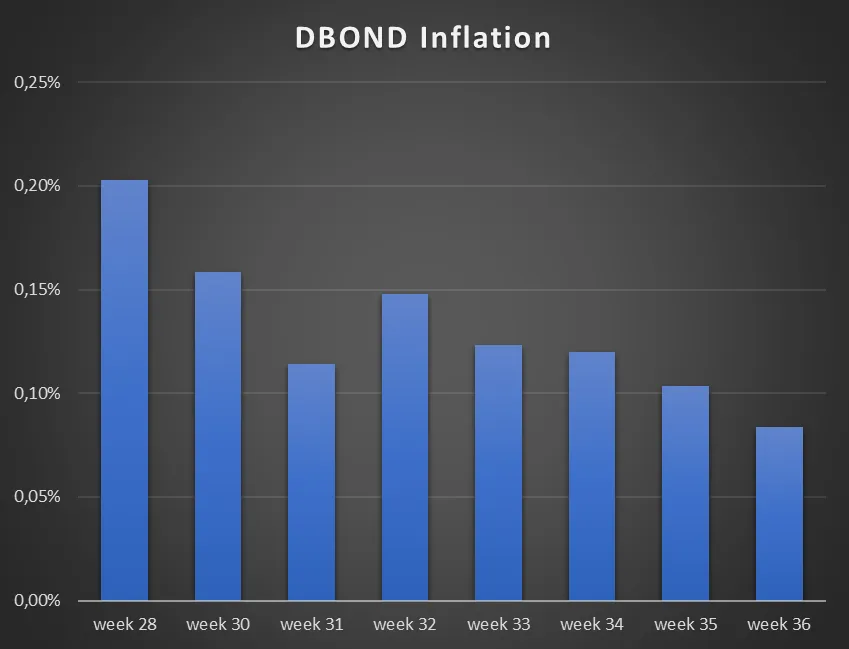
| week 28 | 0.20% |
| week 29 | 63.40% |
| week 30 | 0.16% |
| week 31 | 0.11% |
| week 32 | 0.15% |
| week 33 | 0.12% |
| week 34 | 0.12% |
| week 35 | 0.10% |
| week 36 | 0.08% |
| week 37 | 95.92% |
At this point, the average DBOND Inflation is 0.13%. I removed the week 29 and week 37 from the calculation since that DBOND were not generated trough DAB stake but were related to a new public sale release.
DAB
Let's see what DAB holders will prefer if more DBOND or continue to only receive Hive drips.
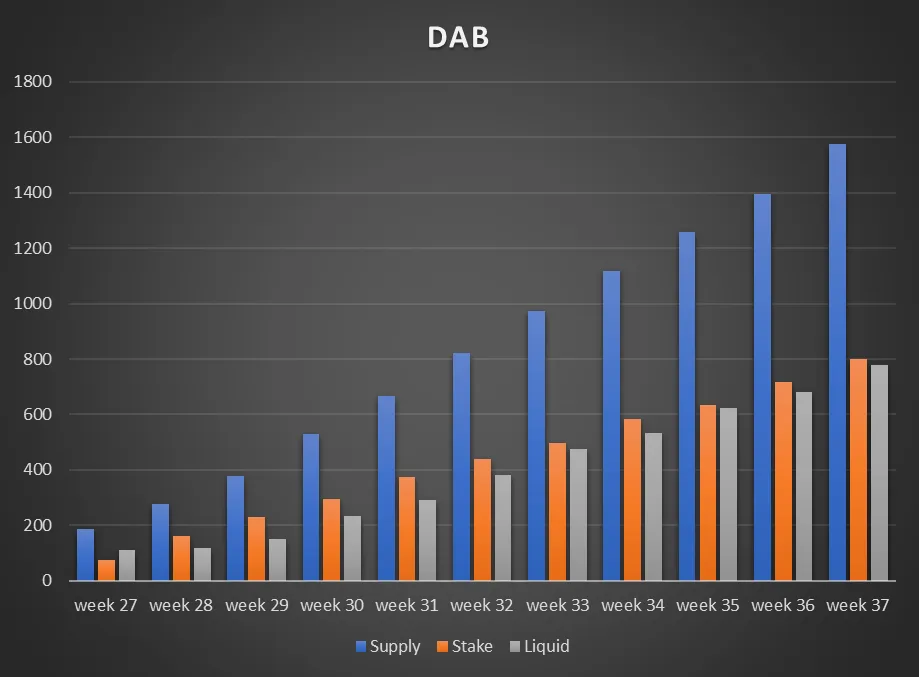
| Supply | Stake | Liquid | |
|---|---|---|---|
| week 27 | 185.76 | 76.27 | 109.49 |
| week 28 | 277.56 | 160.748 | 116.812 |
| week 29 | 379.06 | 229.001 | 150.059 |
| week 30 | 528.66 | 293.755 | 234.905 |
| week 31 | 665.06 | 375.667 | 289.393 |
| week 32 | 821.7 | 438.88 | 382.82 |
| week 33 | 972.18 | 498.182 | 473.998 |
| week 34 | 1117.38 | 583.224 | 534.156 |
| week 35 | 1258.18 | 634.786 | 623.394 |
| week 36 | 1395.46 | 715.446 | 680.014 |
| week 37 | 1577.62 | 800.538 | 777.082 |
Comparing with the previous week, we have 182.16 increase in supply, 85.092 more DAB staked and more 97.068 DAB liquid.
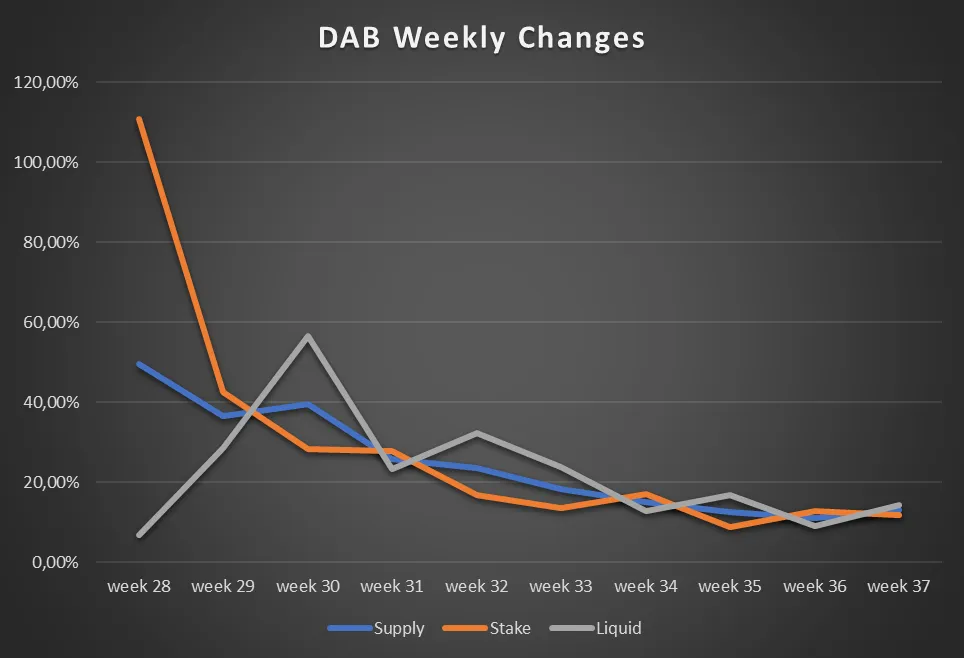
This means our supply increased 13.05%, the DAB staked increased 11.89% and the liquid DAB increased 14.27%.
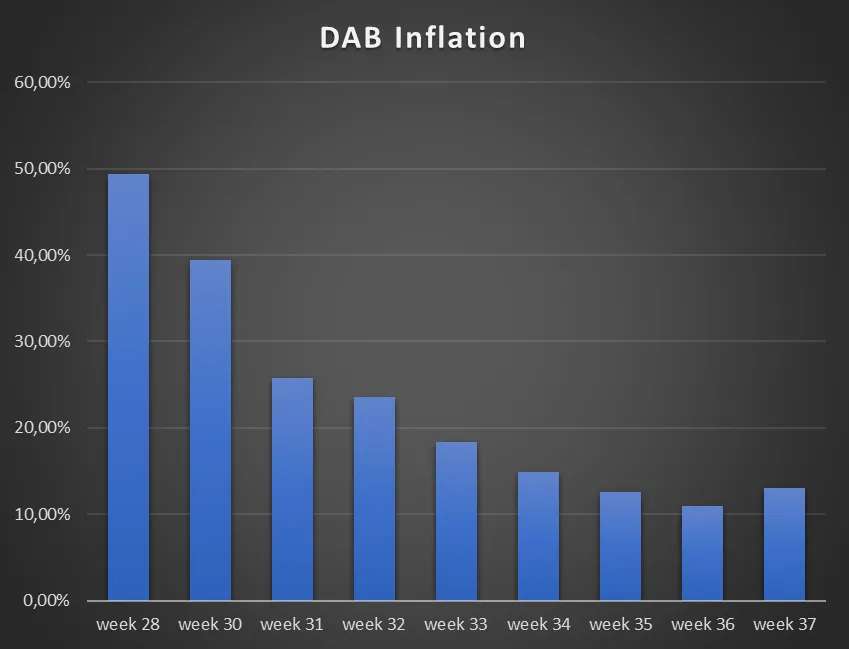
| DAB Inflation | |
|---|---|
| week 28 | 49.42% |
| week 29 | 36.57% |
| week 30 | 39.47% |
| week 31 | 25.80% |
| week 32 | 23.55% |
| week 33 | 18.31% |
| week 34 | 14.94% |
| week 35 | 12.60% |
| week 36 | 10.91% |
| week 37 | 13.05% |
At this point, the average DAB Inflation is 23.12%.