@raymondspeaks and @silverstackeruk launched a new project called @dailydab.
I decided to create a weekly report to follow the development of the tokenomics of both tokens (DBOND and DAB).
Why weekly and not daily?
Because I think a daily post about this, it will be like spam.
To know more about the project, check this link
DBOND
DBOND it is the DAB miner.
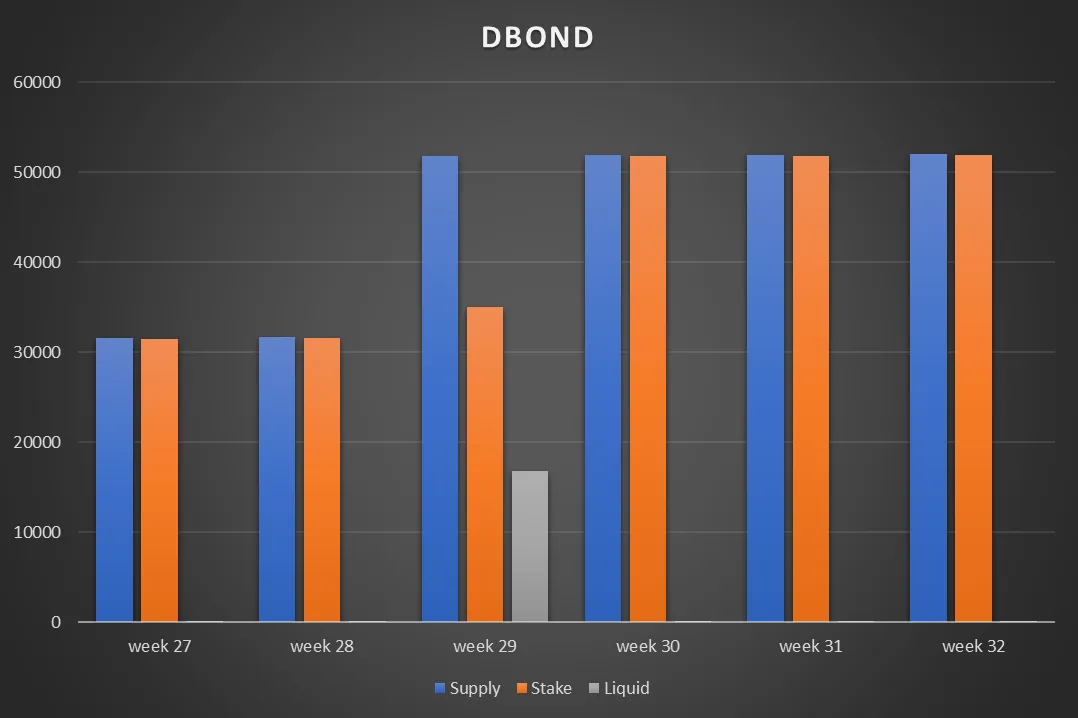
| Supply | Stake | Liquid | |
|---|---|---|---|
| week 27 | 31623.29 | 31466.81 | 156.4835 |
| week 28 | 31687.41 | 31564.8 | 122.6123 |
| week 29 | 51777.92 | 34989.09 | 16788.83 |
| week 30 | 51860.063 | 51742.44457 | 117.6184 |
| week 31 | 51919.163 | 51818.4455107 | 100.7175 |
| week 32 | 51995.993 | 51893.4611 | 102.5319 |
Comparing with the previous week, we have 76.83 increase in supply, 75.01555 more DBOND staked and more 1.814455 DBOND liquid.
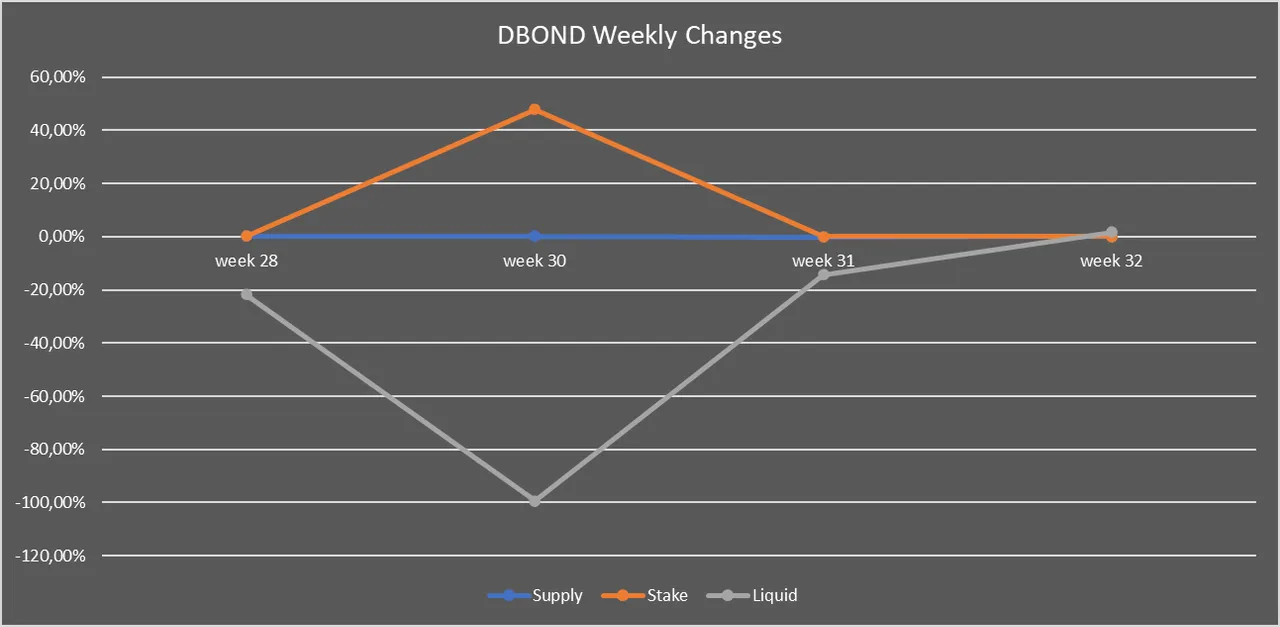
This means our supply increased 0.148%, the DBOND staked increased 0.14% and the liquid DBOND increased 1.80%.
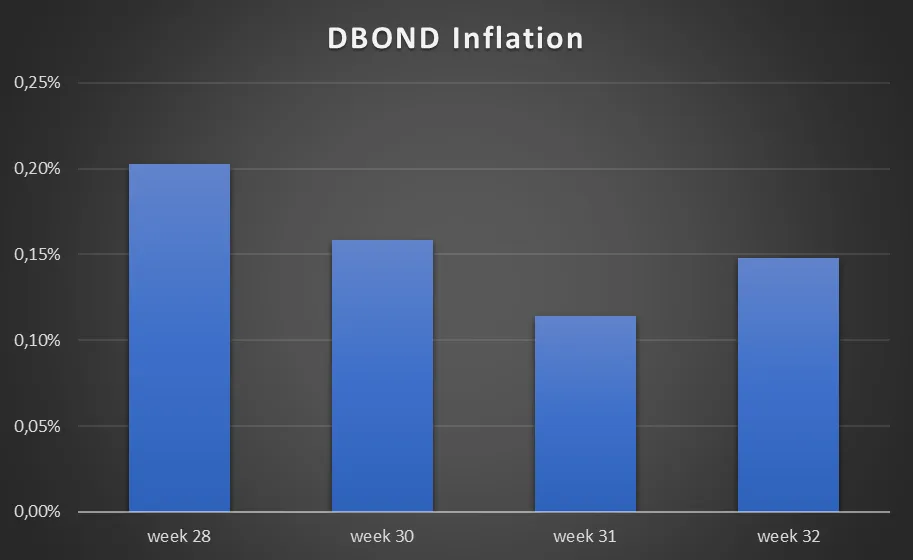
| DBOND Inflation | |
|---|---|
| week 28 | 0.20% |
| week 29 | 63.40% |
| week 30 | 0.16% |
| week 31 | 0.11% |
| week 32 | 0.15% |
At this point, the average DBOND Inflation is 0.16%. I removed the week 29 from the calculation since that DBOND were not generated trough DAB stake but were related to a new public sale release.
DAB
Let's see what DAB holders will prefer if more DBOND or continue to only receive Hive drips.
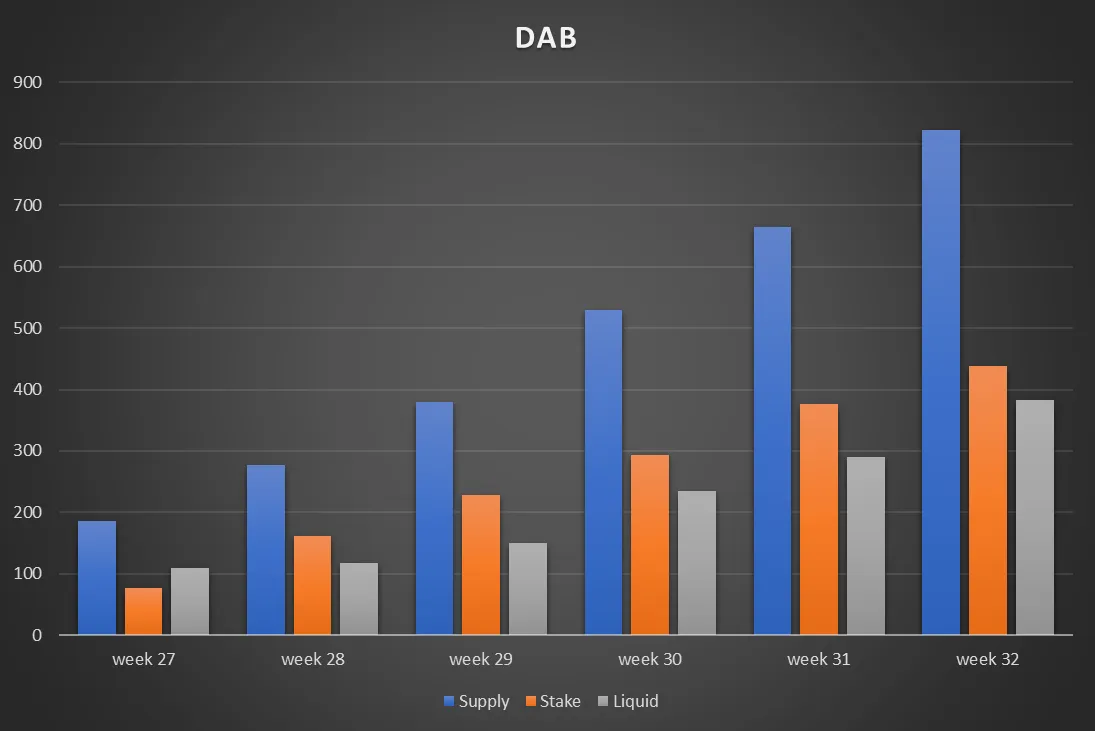
| Supply | Stake | Liquid | |
|---|---|---|---|
| week 27 | 185.76 | 76.27 | 109.49 |
| week 28 | 277.56 | 160.748 | 116.812 |
| week 29 | 379.06 | 229.001 | 150.059 |
| week 30 | 528.66 | 293.755 | 234.905 |
| week 31 | 665.06 | 375.667 | 289.393 |
| week 32 | 821.7 | 438.88 | 382.82 |
Comparing with the previous week, we have 156.64 increase in supply, 63.213 more DAB staked and more 93.427 DAB liquid.
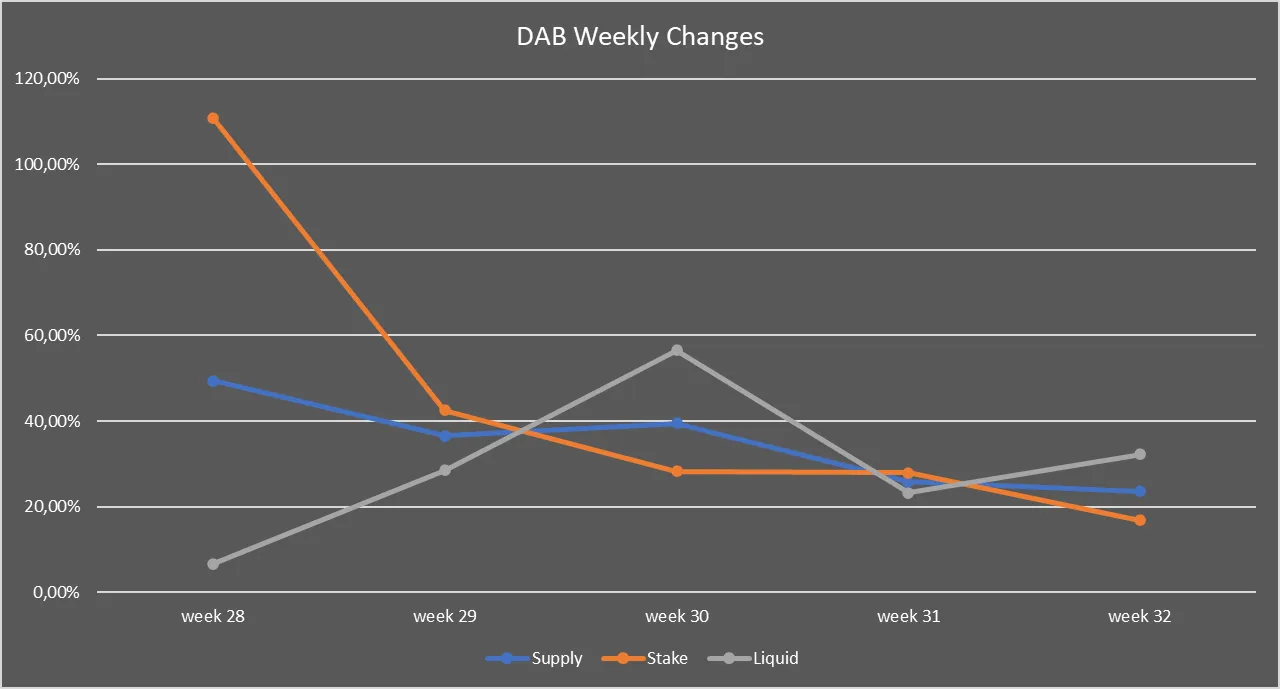
This means our supply increased 23.55%, the DAB staked increased 16.83% and the liquid DAB increased 32.28%.
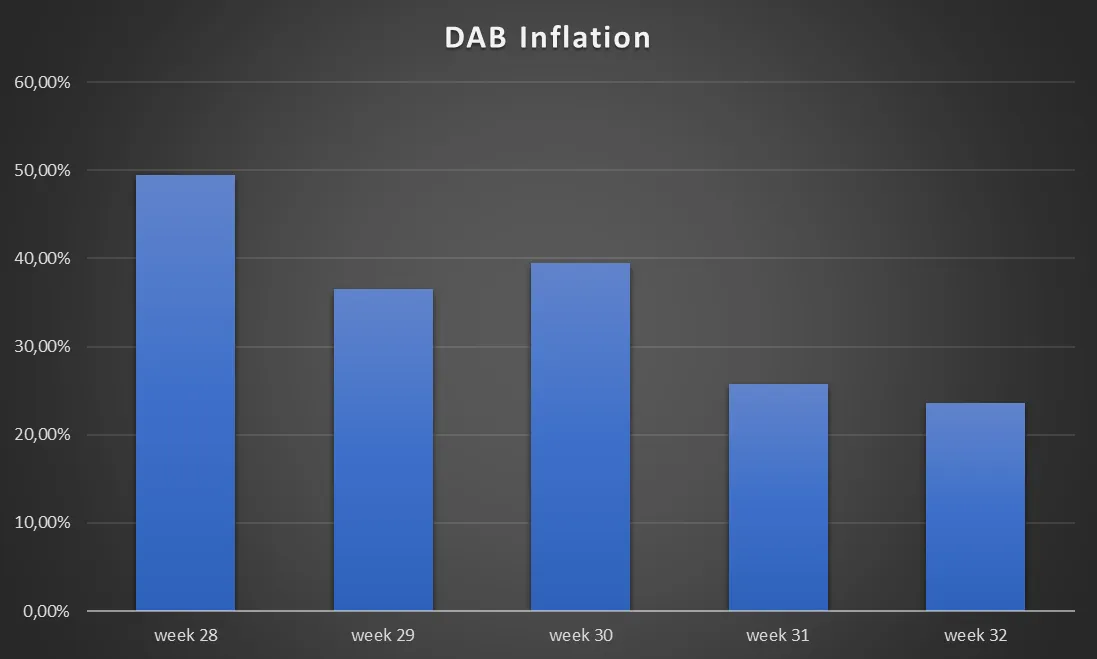
| DAB Inflation | |
|---|---|
| week 28 | 49.42% |
| week 29 | 36.57% |
| week 30 | 39.47% |
| week 31 | 25.80% |
| week 32 | 23.55% |
At this point, the average DAB Inflation is 34.96%.