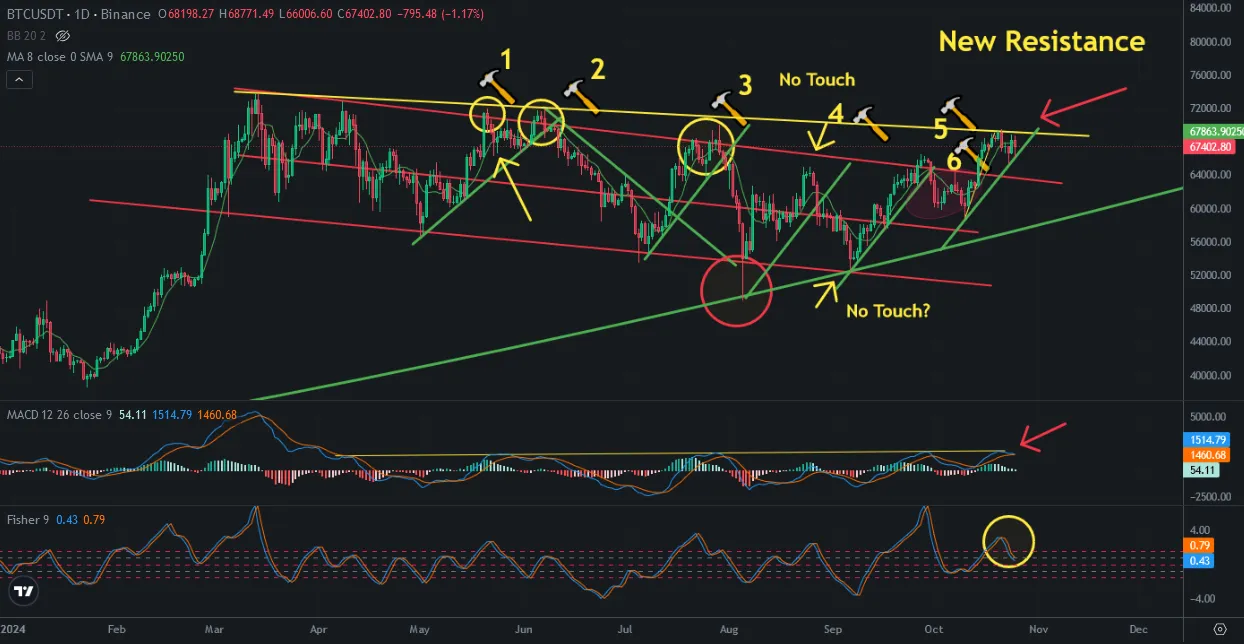
Bitcoin is in between uptrend and downtrend lines. There was downtrend line on Bitcoin price chart, I drew it as yellow. Even Bitcoin price went up fast nowadays, It could not break this downtrend line. Even Bitcoin price broke up descending channel, It could not break up this downtrend line.
Here you can see daily chart of Bitcoin. I drew uptrend line paralel as the last one. Bitcoin price stucked into these lines. It may be the decision for up or down in next week.
Today Bitcoin price went down with small FUD. I shared a post and waiting for price correction on Bitcoin price chart. It woyld give us opportunity to pick up discounted crypto and I started. I am starting to pick up discounted crypto today.
There is also great resistance on MACD Indicator. It is very hard to see breaking up before 2024 US election. This resistance is why Bitcoin price can not go up!
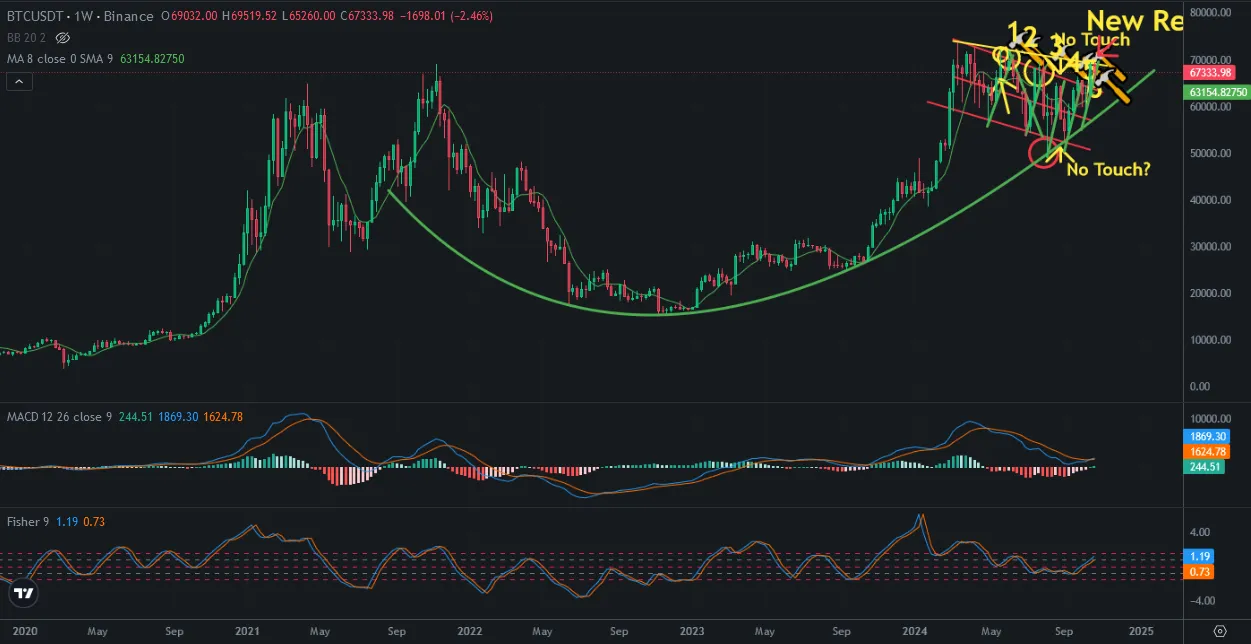
Here you can see weekl chart of Bitcoin. Even Bitcoin price can not break up downtrend line, weekly chart seems very bullish! MACD Indicator reversed from the bottom. Fisher Indicator also follows MACD Indicator as bullish. This is midterm bullish scenario..
As I said, I started to pick up discounted crypto. I hope I can pick up more..
We will see..