Technical analysis of BTC/USD April 28, 2022
Good morning dear friends, mainly I want to wish you an excellent and successful day, I hope you are very well and get comfortable to read the analysis that I bring you for today April 28, 2022.
Buenos días queridos amigos, principalmente quiero desearte un excelente y exitoso día, espero que estén muy bien y se pongan cómodos para leer el análisis que les traigo para el día de hoy 28 de Abril del 2022.
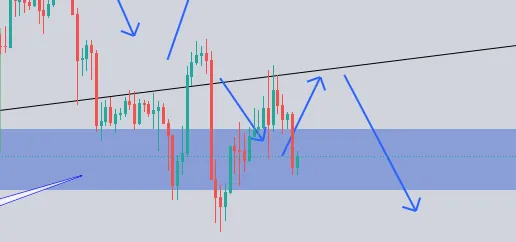
In the previous analysis, as shown in the image, we left a projection for the Bitcoin, in which we considered two possible scenarios, to take into account when making decisions.
En el análisis anterior, como lo muestra la imagen, dejamos una proyección para el Bitcoin, en la cual nos planteamos dos escenarios posibles, para tener en cuenta a la hora de tomar decisiones.
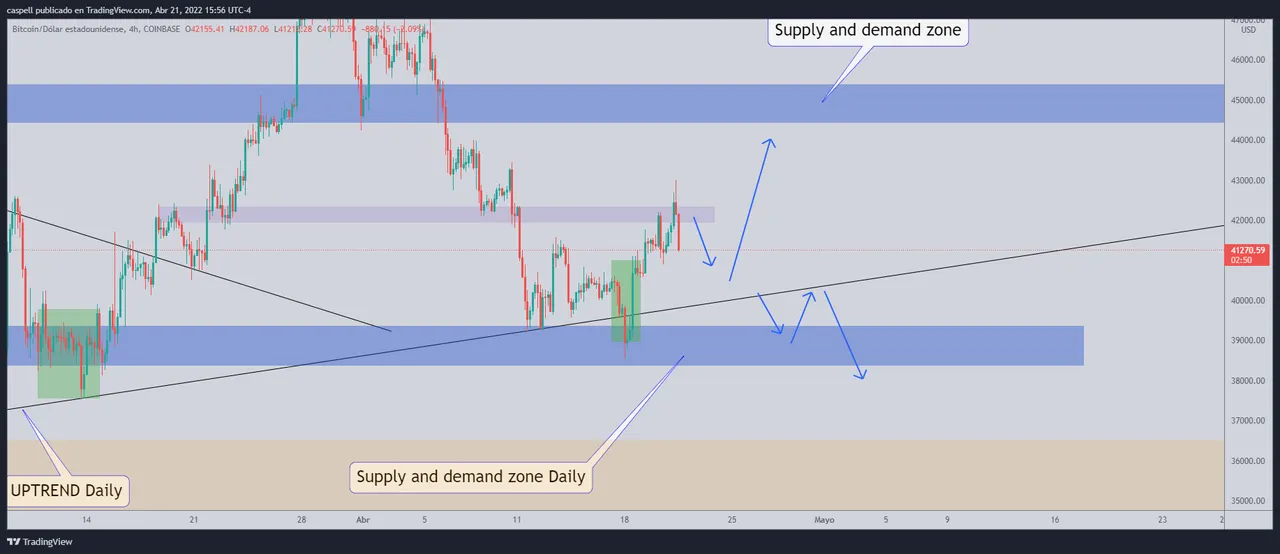
You can see the analysis above / Pueden observar el análisis anterior: https://leofinance.io/@caspell/eng-esp-technical-analysis-btcusd-21-arpil-2022-analisis-tecnico-del-btcusd-21-abril-2022
Today, April 28, Bitcoin is trading like this:
Hoy 28 de abril el Bitcoin se encuentra así:
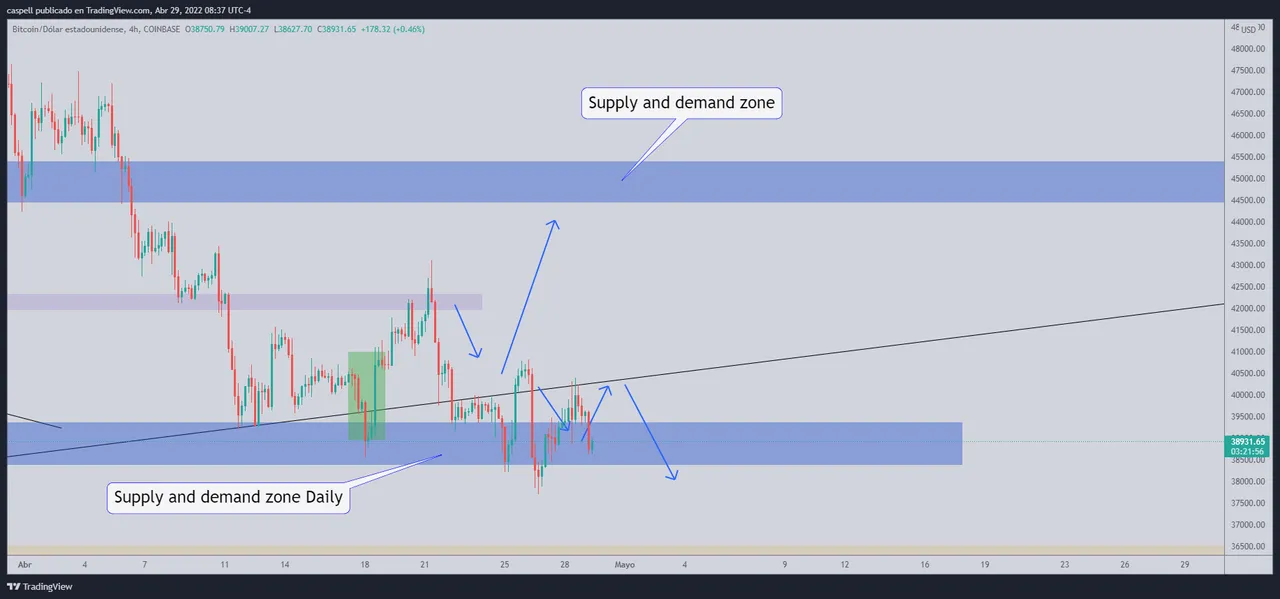
On the chart we can notice that Bitcoin is positioning itself towards our bearish projection.
We can see in 4H that there was already a red candle showing us that sellers are taking control, which represents the rejection of the trendline Daily that is working as resistance.
En el gráfico podemos notar que el Bitcoin está posicionándose hacia nuestra proyección bajista.
Podemos ver en 4H que ya hubo una vela roja que nos muestra que los vendedores están tomando el control, lo cual representa el rechazo a la línea de tendencia alcista diaria que está funcionando como resistencia.
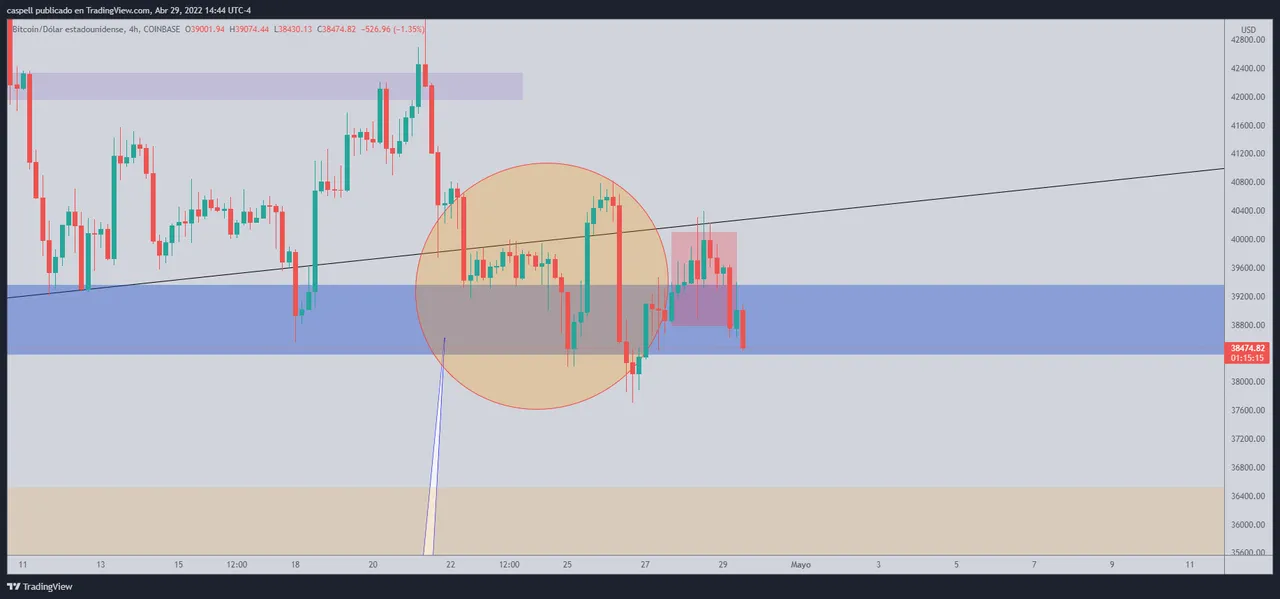
TimeFrame Daily
The TimeFrame Daily shows a possible breakout of the Daily bullish trendline we have plotted on the chart.
El el Periodo de tiempo Diario observamos que se está produciendo un posible quiebre de la línea de tendencia alcista Daily que tenemos trazada en el gráfico.
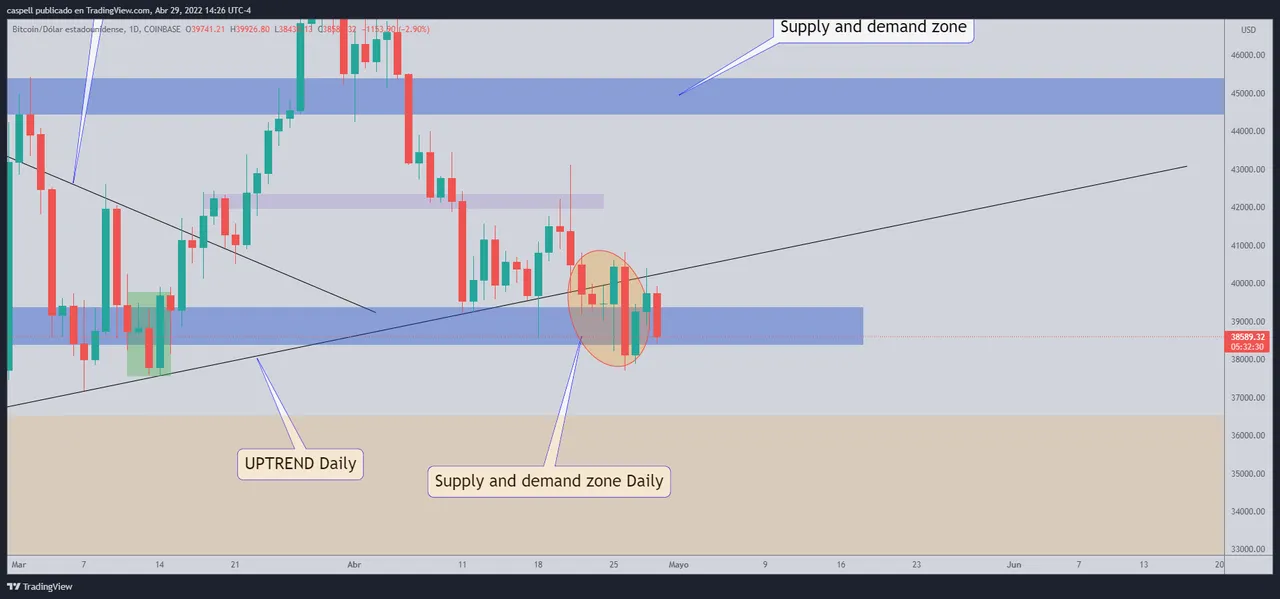
After this bearish candlestick marked with the ellipse, there is a retracement (retest) of the bullish trendline we have plotted on the chart.
Luego de esta vela bajista marcada con el elipse, hay un retroceso (retest), de la línea de tendencia alcista que tenemos trazada en el chart.
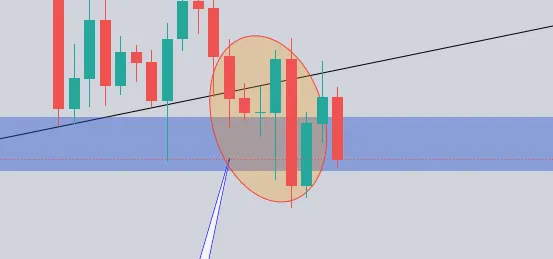
Timeframe 4H
Periodo de 4H
If we look at this breakout on the 4H timeframe, we can clearly see what we have projected in our bearish scenario.
Si observamos este quiebre en el periodo de tiempo de 4H, podemos ver claramente que es lo que tenemos proyectado en nuestro escenario bajista.
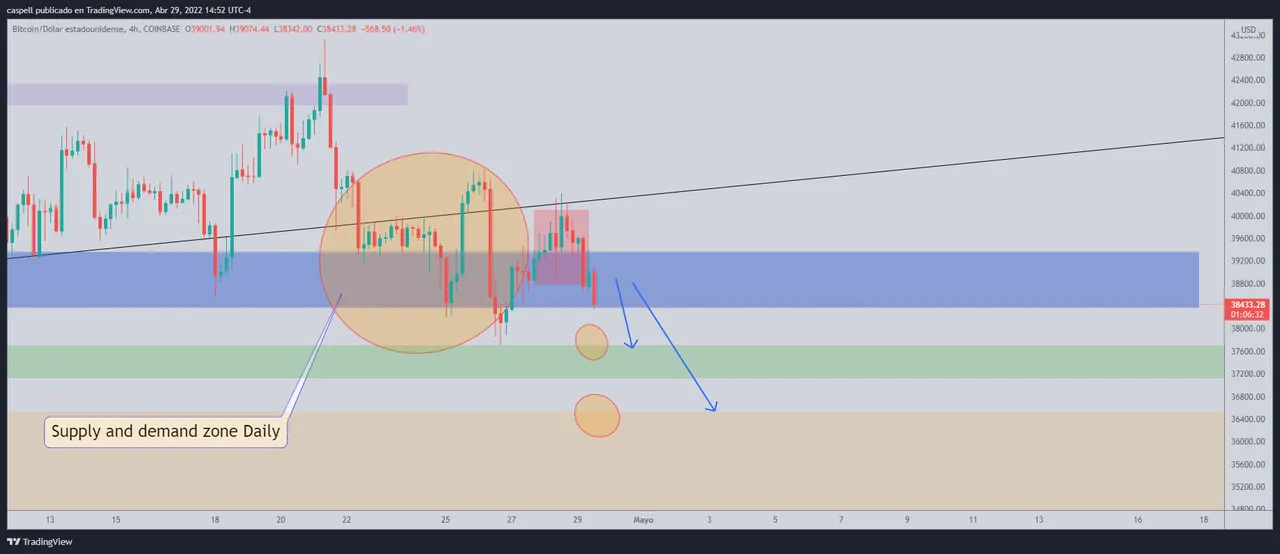
What do we expect from the retest?
¿Qué esperamos del retest?
On the retracement or retest of this trendline, we expect the market to show us a rejection like the one forming on the 4h timeframe.
En el retroceso o retest(prueba) de esta línea de tendencia, esperamos que el mercado nos muestre un rechazo como el que se está formando en el periodo de tiempo de 4h.
This candlestick shows us the rejection of the Daily trendline, which is now working as resistance. This means that the price action is showing us that sellers are taking control, that they have strength so we could go down from TimeFrame to look for a short position and take advantage of the bearish momentum that Bitcoin may give.
Esta vela nos muestra el rechazo a la línea de tendencia alcista Diaria, que ahora está funcionando como resistencia. Es decir que la acción del precio nos está mostrando que los vendedores están tomando el control, que tienen fuerza por lo cual podríamos bajar de periodo de tiempo para buscar posición en short y aprovechar el impulso bajista que pueda dar el Bitcoin.
If you are a Holder, don't worry, you wait for the best price to buy again and accumulate more Bitcoin.
Si tú eres Holder, pues tranquilo, tú espera el mejor precio para volver a comprar y acumular más Bitcoin.
¿Hasta qué precio podríamos proyectar esta bajada para tomar ganancias?
Up to what price could we project this decline to take profits?
Bitcoin is likely to react in these two zones that I will mark with an ellipse. They are two zones which I think the Bitcoin could have a reaction and we can take them as TP (Take Profit) areas.
Posiblemente Bitcoin reaccione en estos dos zonas que marcaré con un elipse. Son dos zonas las cuales pienso el Bitcoin podría tener una reacción y podemos tomarlas como áreas de TP ( Tomar ganancias)
Happy Afternoon wishes you your friend Carlos Solorzano, nice to share my knowledge to contribute a little more to this beautiful community. I hope you like it and most importantly to make the best decisions when investing in the crypto asset market. blessings and success!
Feliz Tarde les desea su amigo Carlos Solorzano, agradable compartir mi conocimiento para contribuir un poco más a esta hermosa comunidad. Espero les guste y lo más importante a tomar las mejores decisiones al momento de invertir en el mercado de crypto activos. ¡Bendiciones y mucho éxito!
My native language is Spanish, I apologize if there are some details in the English
translation.

Buenos días queridos amigos, principalmente quiero desearte un excelente y exitoso día, espero que estén muy bien y se pongan cómodos para leer el análisis que les traigo para el día de hoy 28 de Abril del 2022.
In the previous analysis, as shown in the image, we left a projection for the Bitcoin, in which we considered two possible scenarios, to take into account when making decisions.
En el análisis anterior, como lo muestra la imagen, dejamos una proyección para el Bitcoin, en la cual nos planteamos dos escenarios posibles, para tener en cuenta a la hora de tomar decisiones.
You can see the analysis above / Pueden observar el análisis anterior: https://leofinance.io/@caspell/eng-esp-technical-analysis-btcusd-21-arpil-2022-analisis-tecnico-del-btcusd-21-abril-2022
Today, April 28, Bitcoin is trading like this:
Hoy 28 de abril el Bitcoin se encuentra así:
On the chart we can notice that Bitcoin is positioning itself towards our bearish projection.
We can see in 4H that there was already a red candle showing us that sellers are taking control, which represents the rejection of the trendline Daily that is working as resistance.
En el gráfico podemos notar que el Bitcoin está posicionándose hacia nuestra proyección bajista.
Podemos ver en 4H que ya hubo una vela roja que nos muestra que los vendedores están tomando el control, lo cual representa el rechazo a la línea de tendencia alcista diaria que está funcionando como resistencia.
TimeFrame Daily
The TimeFrame Daily shows a possible breakout of the Daily bullish trendline we have plotted on the chart.
El el Periodo de tiempo Diario observamos que se está produciendo un posible quiebre de la línea de tendencia alcista Daily que tenemos trazada en el gráfico.
After this bearish candlestick marked with the ellipse, there is a retracement (retest) of the bullish trendline we have plotted on the chart.
Luego de esta vela bajista marcada con el elipse, hay un retroceso (retest), de la línea de tendencia alcista que tenemos trazada en el chart.
Timeframe 4H
Periodo de 4H
If we look at this breakout on the 4H timeframe, we can clearly see what we have projected in our bearish scenario.
Si observamos este quiebre en el periodo de tiempo de 4H, podemos ver claramente que es lo que tenemos proyectado en nuestro escenario bajista.
What do we expect from the retest?
¿Qué esperamos del retest?
On the retracement or retest of this trendline, we expect the market to show us a rejection like the one forming on the 4h timeframe.
En el retroceso o retest(prueba) de esta línea de tendencia, esperamos que el mercado nos muestre un rechazo como el que se está formando en el periodo de tiempo de 4h.
This candlestick shows us the rejection of the Daily trendline, which is now working as resistance. This means that the price action is showing us that sellers are taking control, that they have strength so we could go down from TimeFrame to look for a short position and take advantage of the bearish momentum that Bitcoin may give.
Esta vela nos muestra el rechazo a la línea de tendencia alcista Diaria, que ahora está funcionando como resistencia. Es decir que la acción del precio nos está mostrando que los vendedores están tomando el control, que tienen fuerza por lo cual podríamos bajar de periodo de tiempo para buscar posición en short y aprovechar el impulso bajista que pueda dar el Bitcoin.
Si tú eres Holder, pues tranquilo, tú espera el mejor precio para volver a comprar y acumular más Bitcoin.If you are a Holder, don't worry, you wait for the best price to buy again and accumulate more Bitcoin.
Bitcoin is likely to react in these two zones that I will mark with an ellipse. They are two zones which I think the Bitcoin could have a reaction and we can take them as TP (Take Profit) areas.
Posiblemente Bitcoin reaccione en estos dos zonas que marcaré con un elipse. Son dos zonas las cuales pienso el Bitcoin podría tener una reacción y podemos tomarlas como áreas de TP ( Tomar ganancias)
Happy Afternoon wishes you your friend Carlos Solorzano, nice to share my knowledge to contribute a little more to this beautiful community. I hope you like it and most importantly to make the best decisions when investing in the crypto asset market. blessings and success!
Feliz Tarde les desea su amigo Carlos Solorzano, agradable compartir mi conocimiento para contribuir un poco más a esta hermosa comunidad. Espero les guste y lo más importante a tomar las mejores decisiones al momento de invertir en el mercado de crypto activos. ¡Bendiciones y mucho éxito!
translation.