The market begins to show some nerves despite some blowout earnings numbers - time to ramp up a few hedge trades and bank some 52 week high profits.

Portfolio News
In a week where S&P 500 did touch an all time high though it did close 0.33% lower on the week, my pension portfolio rose 0.94% on the back of a 1.88% rise in Japanese stocks and old value mover, De Grey Mining (DEG.AX) up 5.4%.
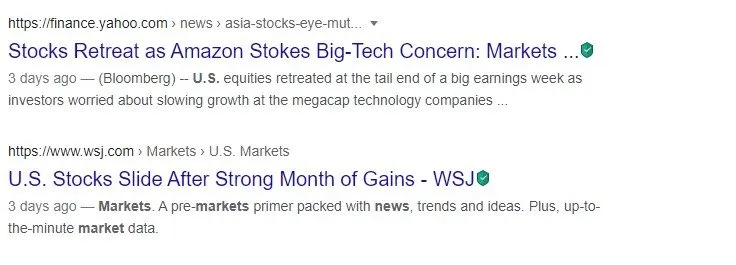
US markets did push to all time highs but got nervous late in the week on earnings data from Amazon and rising Delta variant Covid-19 cases.
Big movers of the week in my portfolios were US Steel (X) (+14.5%), US Masters Residential Property (URF.AX) (+13.6%), Cobalt Blue (COB.AX) (+13.2%), Big Star Energy (BNL.AX) (+12.9%), Yamana Gold (AUY) (+10.6%), Nucor (NUE) (+10.3%). Nippon Steel (5401.T) led the Japan rises, mostly industrial stocks higher at 8.3%.
Crypto booms
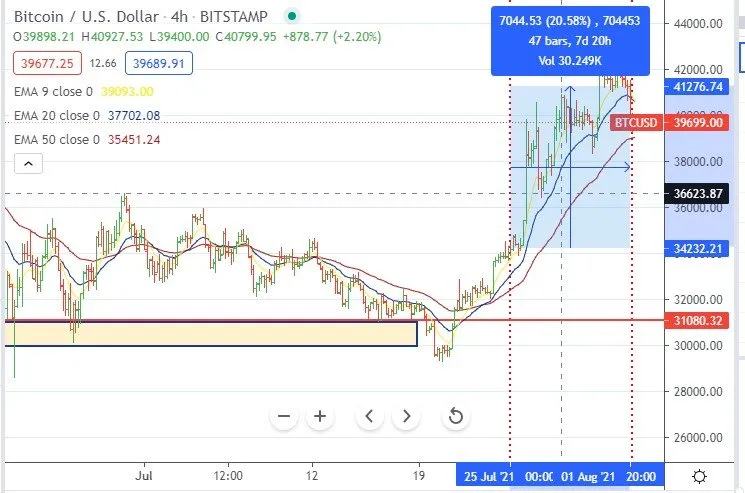
Bitcoin price pushed higher early in the week, pulled back a bit and consolidated a few days before ending the week appreciably stronger - a move of 20% plus in a week is a lot more than we have seen since mid June.
The trigger for the price move was news of the prospects that Amazon would start accepting crypto payments. Then it fell over when Amazon denied everything.

My take is Amazon will in time accept crypto payments - they are always pushing at the edge of new ideas. My guess is it will be some time before we know which they will accept and I am confident that ease of use will be a factor - long wait times and complicated addressing will have to be sorted first.
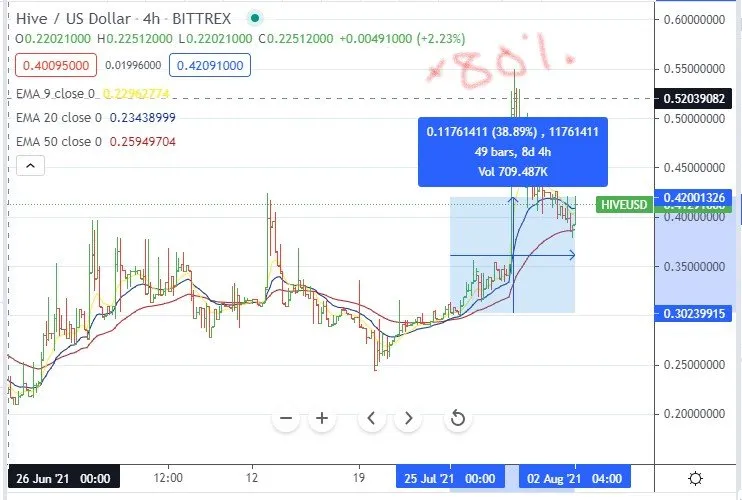
Move of the week in my portfolios was HIVE ending up 38% and at one stage 80% up. I am waiting patiently for the right STEEMBTC point to sell my unstaked STEEM for HIVE.
Bought
Randstad NV (RAND.AS): Europe HR Services. Randstad announced results which beat market estimates yet price was smacked close to 8% from previous close. I added another parcel to average down my entry price and wrote a covered call at 0.54% premium with 5.8% coverage.
Global X Copper Miners ETF (COPX): Copper Mining. I received an ETF Trade Signal pointing to a bullish continuation signal.
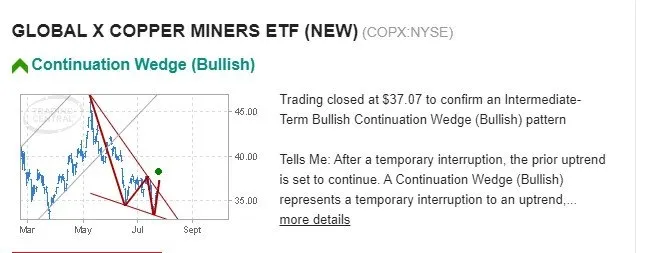
There are a bunch of things to like about the chart - downtrend is broken; divergence on the momentum indicator; a double bottom confirmed. Rather than buy the stock I bought an October 2021 37/45 bull call spread = one strike out-the-money and trading up to the May highs. With net premium of $2.045 this offers maximum profit potential of 291% for a 22% move from $36.86 opening price (July 27)
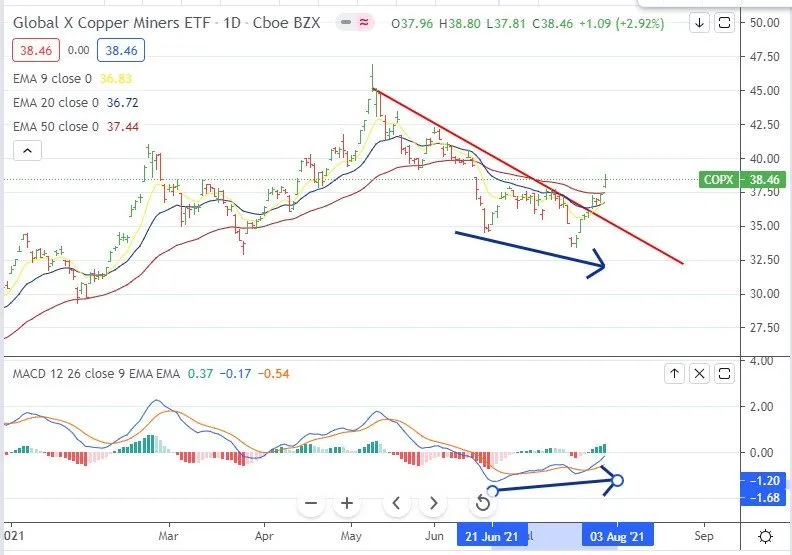
Let's look at the chart which shows the bought call (37) and 100% profit as blue rays and the sold call (45) as a red ray with the expiry date the dotted green line on the right margin. All price has to do is work back to the May highs like it did from late March 2021. The move before was about the same size.
I did lever up the trade by selling a strike 34 put option for August expiry. This is at the levels of the previous two lows. This reduces the net premium to $1.645 and ramps up maximum profit potential to 386%.
Sold
iShares EURO STOXX Mid UCITS ETF (DJMC.AS): Europe Index. Profit taking sale at 52 week high to release some cash for 29% profit since July 2020.
Hedges
I have had good success using gold and silver mining stocks as hedging trades. In one portfolio, I had not replaced hedging trades from the last covered call assignments in May. I had a look at daily charts while I was setting up trades and eyeballed the possibility of a trend reversal ahead of the Federal Reserve meeting. So I bought two silver mining stocks.
Coeur Mining, Inc (CDE): Silver Mining. The daily chart shows how price has been under pressure since the May run up dropping below the base of the 2021 lows. I bough a parcel of stock and also wrote a covered call for August expiry for 3.4% premium and 8.5% coverage for 3 weeks to expiry.
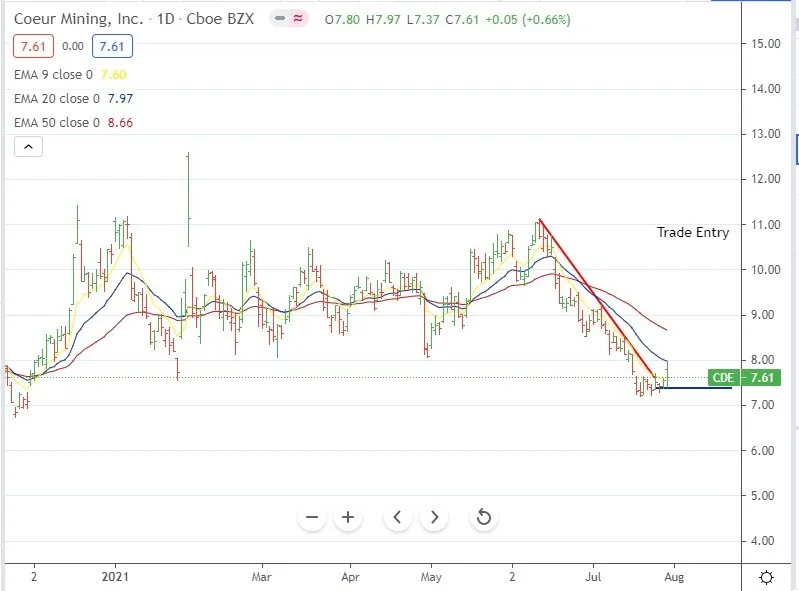
The chart shows the trend line as I envisaged it with trade entry the blue ray. Normally it is better to trade the retest off the reversal - I did not do that in this case as this is a hedging trade. Looks like I got this one right though I could well see the stock being assigned. A naked put makes sense now.
Hecla Mining (HL): Silver Mining. I also bought a parcel to replace stock assigned in May. I wrote a covered call for 2.8% premium with 8.9% coverage for 3 weeks. I also wrote a naked put below recent lows for 1.45% premium with 17% coverage. Dividend yield 0.68%
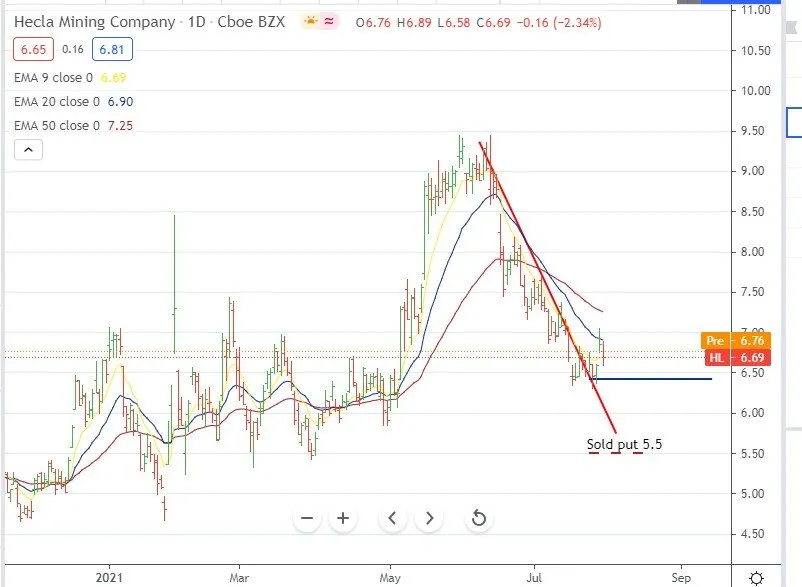
The chart shows the same trend line I eyeballed. This entry is tidier as there was a break and retest back down to the trendline. This stock also looks like it will be assigned but the naked put looks very safe this week. Of note is this chart looks quite different to Coeur Mining with a big run up in price in May not really seen in the other. There will be some fundamental factor at play there - Hecla Mining is currently not generating profits whereas Coeur Mining is.
Cryptocurrency
Fantom (FTMBTC): I continue to track the 10 coins for my new Rising 10 Portfolio against BTC and ETH. The chart shows that price has made a reversal off a level it has respected in the past (the horizontal red line) and has made a higher high. Some technical analysts would call this a double bottom - maybe it is.
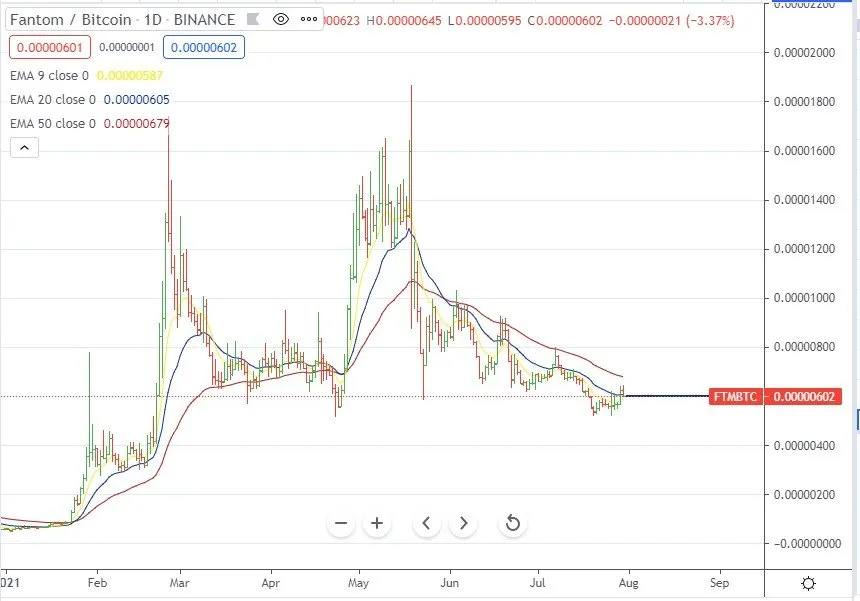
My trade entry is the blue ray - the price at the time I made the chart is higher (the green box).
HNT (HNTBTC): This chart is not as clear cut because it has not made a higher high.
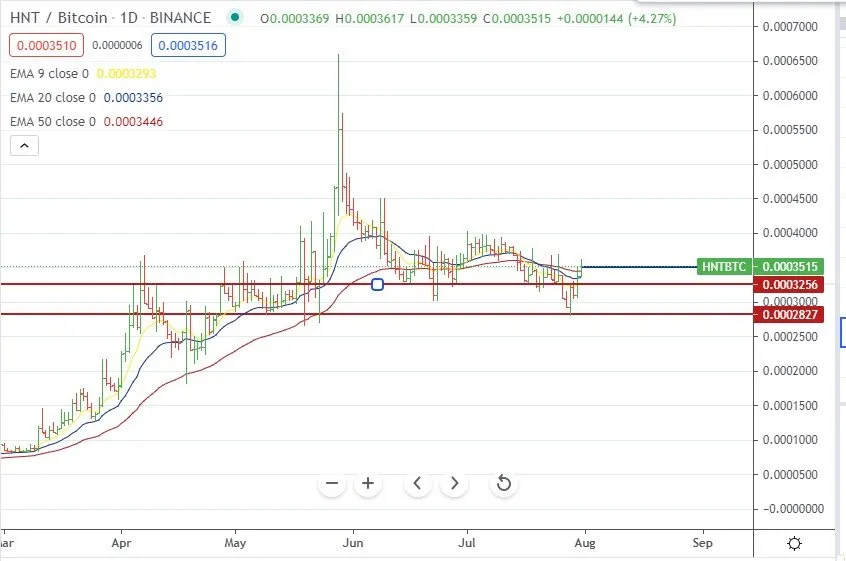
What I like is it has respected the lower level and pushed through two more resistance levels. I have only drawn in the top one which covers the highs for the May consolidation and the lows in June and July. That makes it a strong support line - the patient trader would wait for the pull back and bounce. But for me this is an investing entry - not a trading entry.
Income Trades
A quiet week for income trades with 4 covered calls (3 US and 1 Europe) and 5 naked puts (all US) in two portfolios.
Naked Puts
With some solid earnings announcements in the first week of earnings I sold a few naked puts ahead of earnings all on stocks that are on Jim Cramer's Action Alerts Plus buy list - namely Abbott Laboratories (ABT) (4.3%), Advanced Micro Devices, Inc. (AMD) (12%), Alphabet Inc. (GOOGL) (14%). Coverage from July 27 open in brackets.
Currency Trades
Well I got back on the horse and went back to basics to explore some trend trades. I ran the daily scan and picked candidates that were trending (moving averages stacked in the right order) and which had shown a daily bar the day before in the direction of the trend. I then checked one of my trade signal services and picked two trades that it was signalling. I also checked that the momentum indicators were not showing divergence the other way.
Australian Dollar (AUDUSD): A classic short trade set up. Price is making lower highs and lower lows. Price has broken the neckline on a reverse head and shoulders and has retraced back to resistance line.
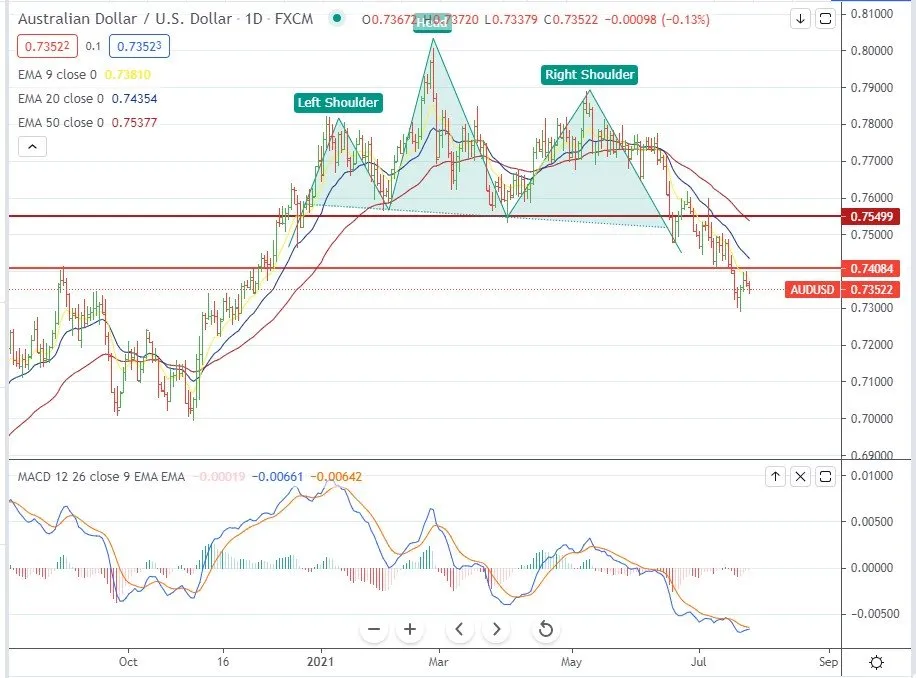
Trade did not work out that way - it did go lower and then retraced back to the 20 day moving average (blue line) and then reversed on that. Stopped out for 0.5% loss. Probably a 50:50 trade setup - waiting for the test of 20 EMA changes it to 60:40.
Australian Dollar (AUDNZD): Also a short setup. What interested me in this setup was the bearish engulfing bar followed by another seller bar (the two red bars on the right). I knew this was no better than a 50:50 trade because of that horizontal level. Price has broken through it but it has not tested it.
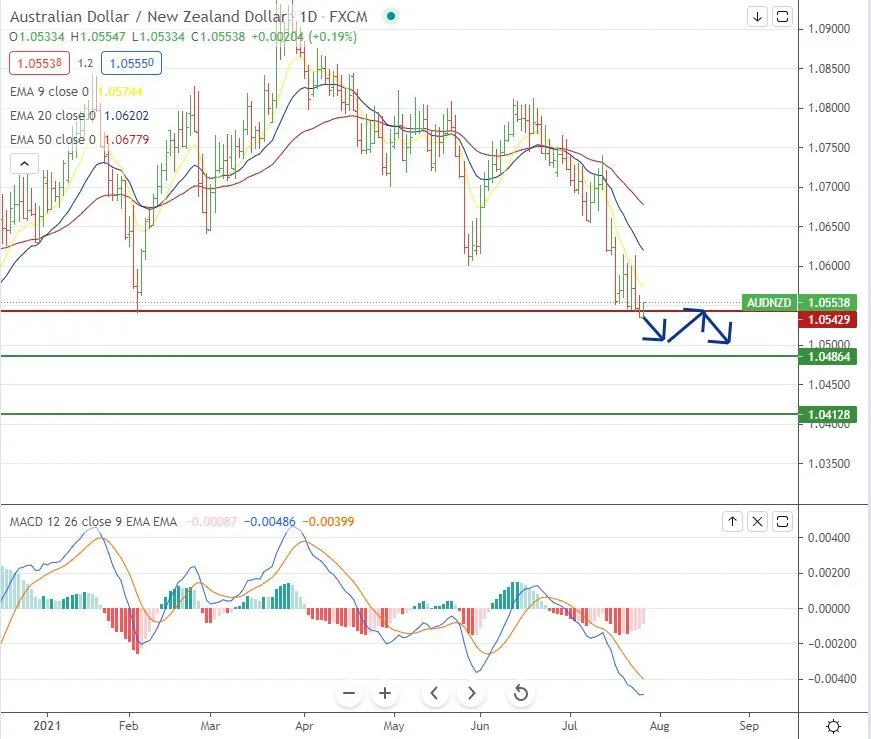
The blue arrows show what would have been a better setup - wait for the break to be confirmed. This trade also stopped out for 0.5% loss with price pulling back to the 20 day EMA as well and then dropping from there.
Two lessons cost 1% ($80) - wait for trades to pull back to the moving averages.
Cautions: This is not financial advice. You need to consider your own financial position and take your own advice before you follow any of my ideas
Images: I own the rights to use and edit the Buy Sell image. News headlines come from Google Search. All other images are created using my various trading and charting platforms. They are all my own work
Tickers: I monitor my portfolios using Yahoo Finance. The ticker symbols used are Yahoo Finance tickers. Crypto tickers come from TradingView
Charts: http://mymark.mx/TradingView - this is a free charting package. I have a Pro subscription to get access to real time forex prices
Bitcoin: Get started with mining Bitcoin http://mymark.mx/Galaxy
Trading: Binance offers a wide range of coins to trade, tight spreads and low fees if you use BNB to pay https://mymark.mx/Binance
Tracking: Keeping track of your crypto trades is a whole lot easier with CoinTracking.info. Get 10% off all your account upgrades https://mymark.mx/CoinTracking
July 26-30, 2021