How to recognize reversal patterns on the chart
Today, the Dow Jones made a trend change on the daily chart, providing a good teaching example of chart analysis.
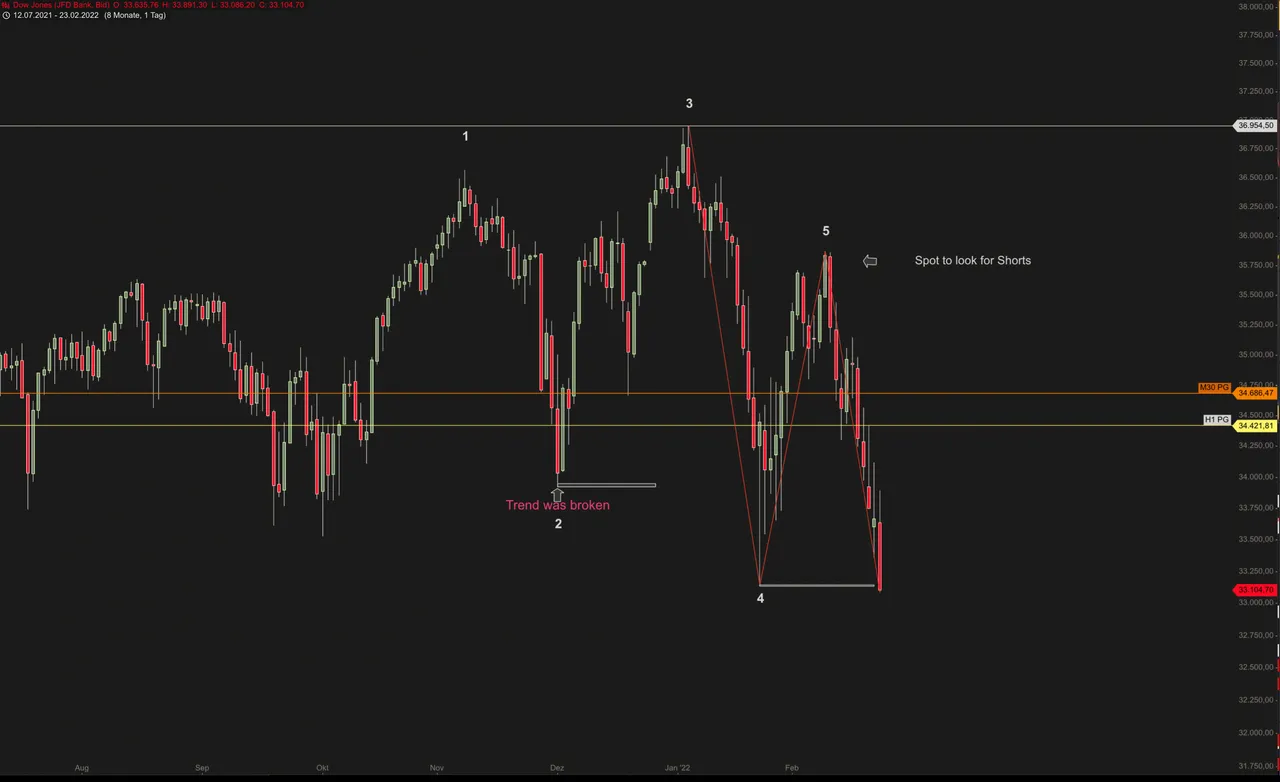
Analysts and their statements are usually based on trend phases in the market, and the highs and lows play an important role. If we see a sequence of higher highs and lows, then we are in an intact uptrend. Lower highs and lows logically indicate a downtrend.
There is also the so-called sideways phase, here the price remains trapped in a certain price range. For the targeted entry such a thing is important, because the trend forms the basis for very many market participants and their decisions.
Today, the Dow has fallen below an important low and thus triggered the downward trend. The trend break before was the first warning sign in the market and now we see a bearish confirmation. For all friends of reversal patterns in the chart, the Dow is usually very accurate with such signals. Today's signal is called 123 low in German, I call it 12345 reversal.
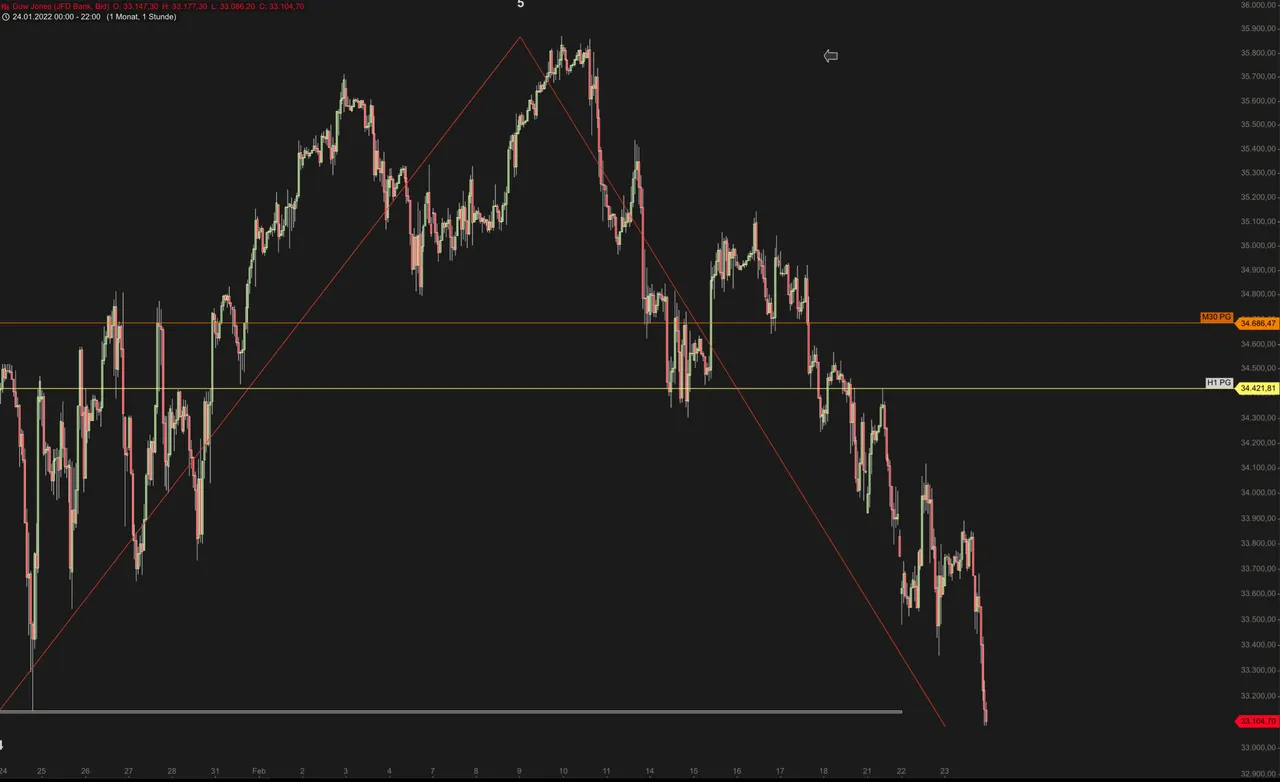
The trick here is to get a position in wave 5, because it pops here pretty regularly times. The position is theoretically only possible today, as we are only now seeing the completed downtrend. I usually try to get here a little earlier in the market and since the H1 and M30 PG has offered itself yes. However, the movement has already run far for the small PGs and a retracement is not unlikely. The return, however, would not be a problem for the downtrend, because it only breaks again above the 35875.
For those who are fundamentally wondering what I or the other traders are even doing, we are riding the trend up and down. The entries are crucial in short-term trading and therefore chart formations are an often used tool.
Translated with www.DeepL.com/Translator (free version)
Wie erkenne ich Umkehrmuster im Chart
Heute hat der Dow Jones einen Trendwechsel auf dem Tageschart vollzogen und bietet so ein gutes Lehrbeispiel der Chartanalyse.
Die Analysten und deren Aussagen beruhen meist auf Trendphasen im Markt, die Hochs und Tiefs spielen dabei eine wichtige Rolle. Sehen wir eine Abfolge von höheren Hochs und Tiefs, dann befinden wir uns in einen intakten Aufwärtstrend. Tiefere Hochs und Tiefs deuten folgerichtig auf einen Abwärtstrend hin.
Es gibt auch noch die sogenannte Seitwärtsphase, hier bleibt der Preis in einer bestimmten Preisrange gefangen. Für den gezielten Einstieg ist sowas wichtig, denn der Trend bildet die Grundlage für sehr viele Marktteilnehmer und dessen Entscheidungen.
Der Dow hat heute ein wichtiges Tief unterschritten und somit den Abwärtstrend ausgelöst. Der Trendbruch zuvor war das erste Warnzeichen im Markt und jetzt sehen wir eine bärische Bestätigung. Für alle Freunde von Wendemustern im Chart, der Dow ist bei solchen Signalen meist sehr genau. Das heutige Signal trägt im deutschen den Namen 123 Tief, ich bezeichne es als 12345 Umkehr.
Der Trick hier ist eine Position in die Welle 5 zu bekommen, denn hier knallt es ziemlich regelmäßig mal. Die Position ist theoretisch erst heute möglich, da wir ja erst jetzt den fertigen Abwärtstrend sehen. Ich versuche hier meist etwas früher in den Markt zu kommen und da hat sich die H1 und M30 PG ja angeboten. Die Bewegung ist aber schon weit gelaufen für die kleinen PGs und ein Rücklauf ist nicht unwahrscheinlich. Der Rücklauf wäre aber kein Problem für den Abwärtstrend, denn der geht erst wieder über der 35875 kaputt.
Für alle die sich grundlegend fragen was ich oder die anderen Trader überhaupt machen, wir reiten den Trend rauf und runter. Die Einstiege sind im kurzfristigen Handel ausschlaggebend und deshalb sind Chartformationen ein oft genutztes Mittel.
Source/Quelle Charts: Tradingview / Binance / Guidants - GodmodeTrader
Für mehr Informationen rund ums Trading empfehle ich meinen
Discord Channel: https://discord.gg/j5A3CUq
Twitter: https://mobile.twitter.com/TraderOut
Risikohinweis:
Dieser Post stellt keine Anlageberatung oder sonstige Empfehlung dar.
Die dargestellten Analysen, Techniken und Methoden dienen ausschließlich Informationszwecken
und stellen weder eine individuelle Anlageempfehlung noch ein Angebot zum Kauf oder Verkauf
von Finanzinstrumenten dar, sondern spiegeln lediglich die Meinung des Referenten wider.
Eine Haftung ist ausgeschlossen.
Legal Disclaimer:
I am not a financial advisor
nor is any content in this article presented
as financial advice. Never invest more
than what you can afford to lose.
This post is my personal opinion,
do your own research before making any investment decisions.
If you make any trades after reading this post,
it is completely in your responsibility.