This week, I experienced another slide in my X metrics. Here's a look:

Impressions are down 14 percent while Likes and Reposts are down 29 percent and 27 percent, respectively. On the upside, Engagement Rate increased 13 percent, Profile Visits went up 25 percent, and New Follows bounced upward 12 percent. While Replies declined by 60 percent, Video Views and Media Views increased 275 percent and 300 percent, respectively.
I need to focus on generating more video and media reviews. Perhaps I should post more videos.
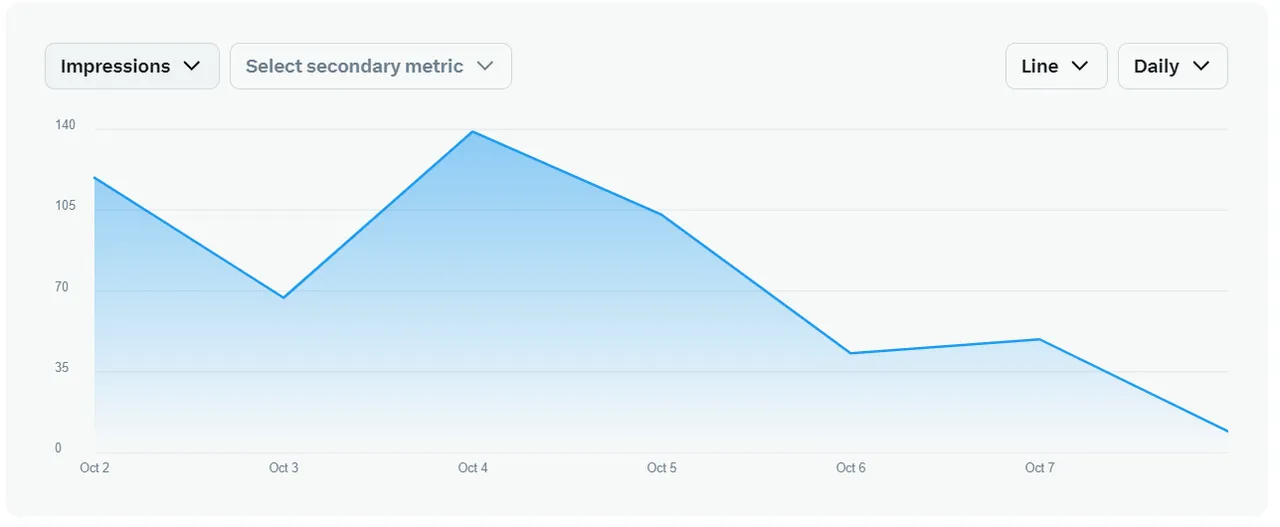
Impressions and Engagements
Impressions show a peak on October 4, then a steady decline afterward.
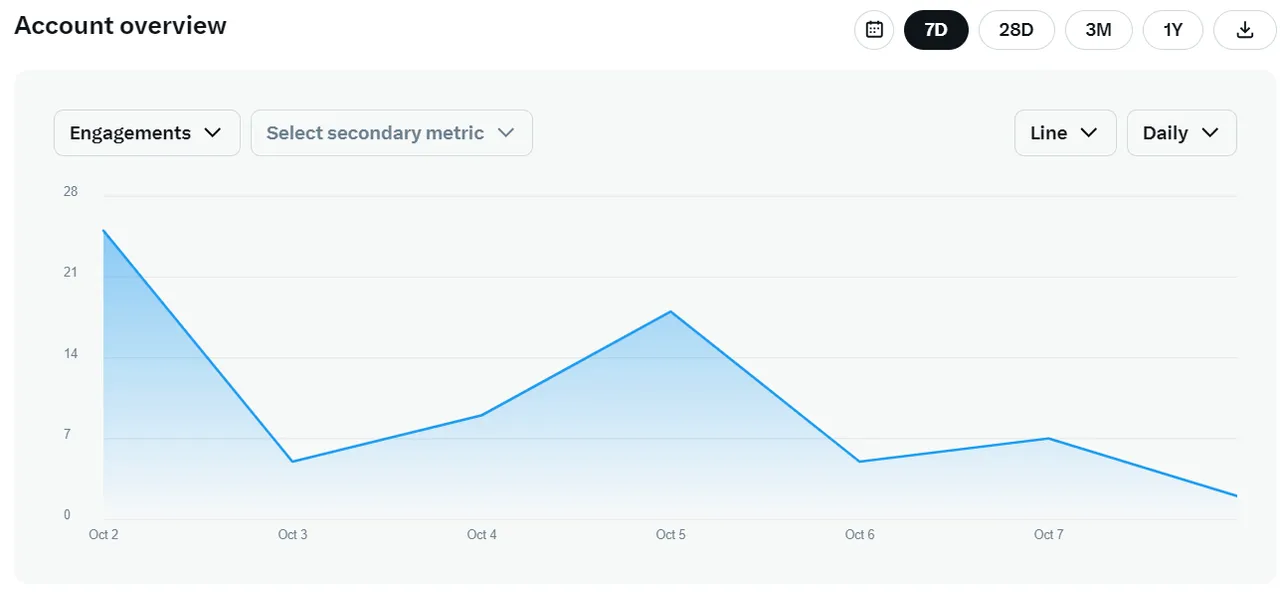
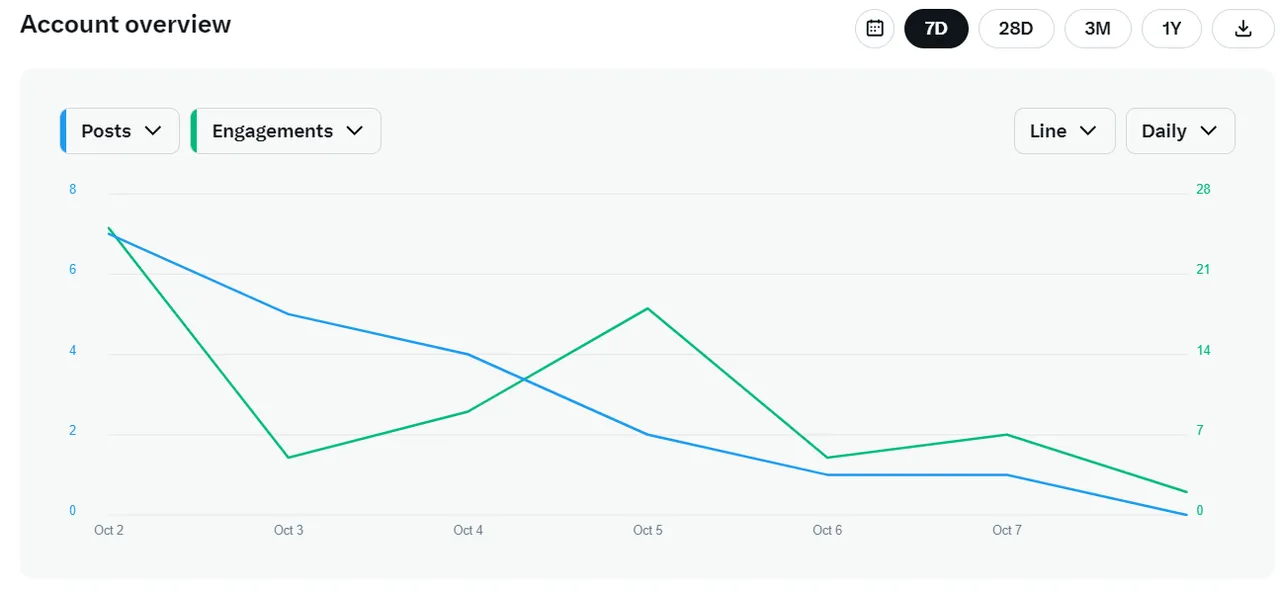
Engagements peaked on October 2 with a sharp decline and another hilltop on October 5.
Likes are pretty steady throughout the week.

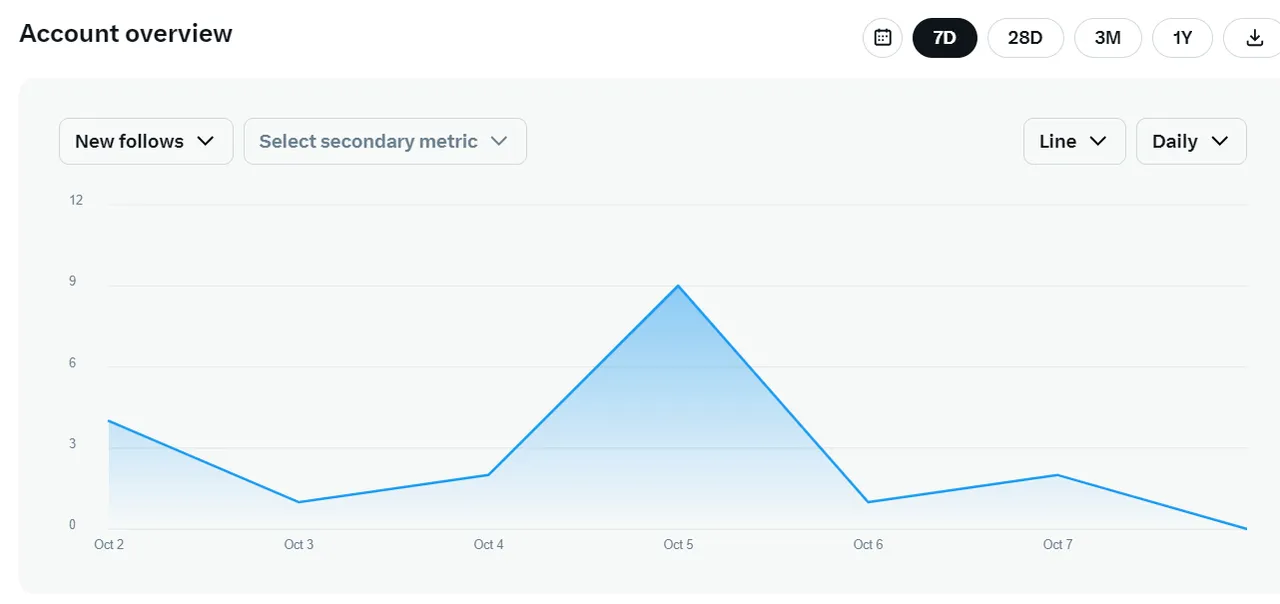
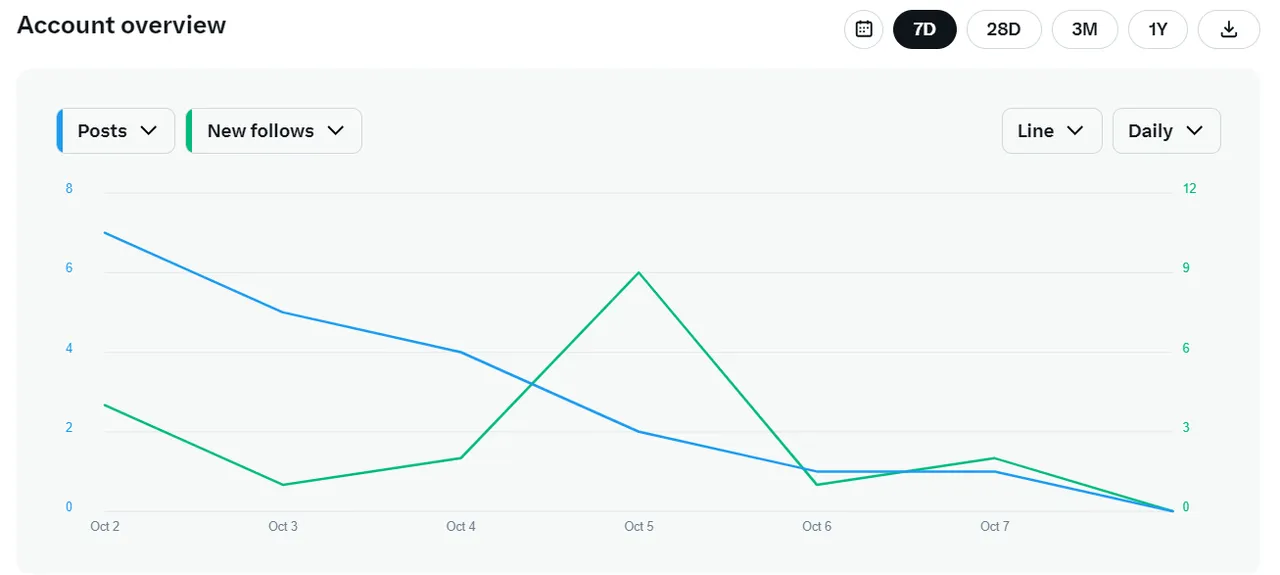
New follows peaked on October 5.
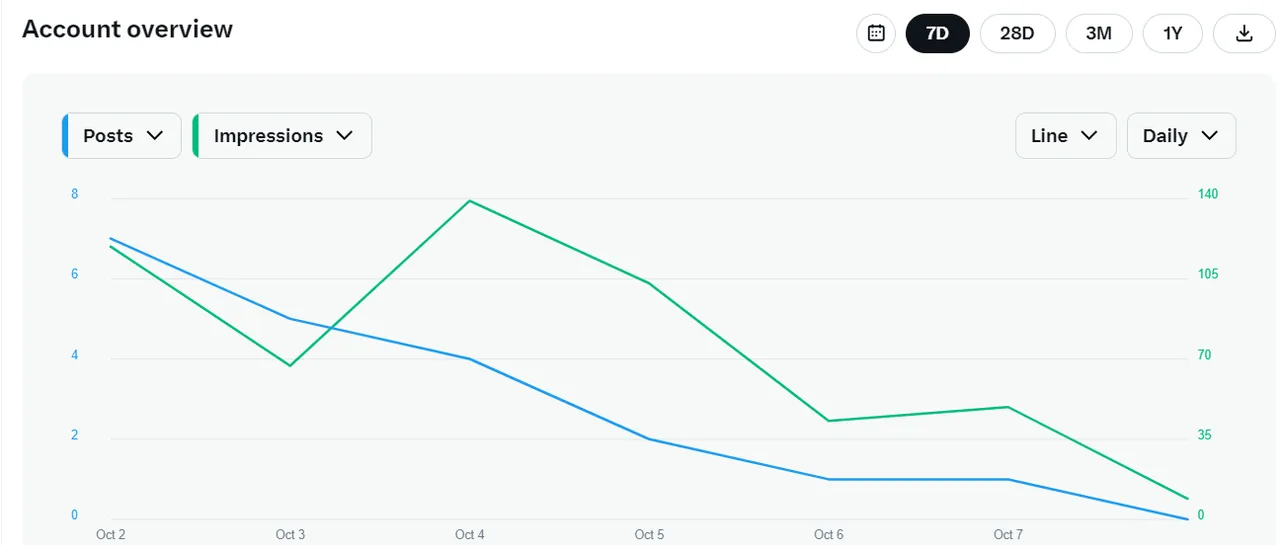
Here's a new metric I haven't seen before. X started showing the number of posts for each day throughout the week. My posting peaked on October 2 and steadily declined throughout the week. I need to fix that.

You can see the correlation between Impressions and Posts in this graph:
Here's the correlation between Posts and Engagements:
And you can even see the correlation between Posts and New Follows:
While the correlation between Engagements and Posts and New Follows and Posts aren't 1:1, you can see a general trend where the decline in Posts leads to a trending decline in Engagements and New Follows. It's pretty clear to me what I need to do to increase my metrics. What do you think?