
Introduction
Cardano (ADA) is a blockchain platform that has gained significant attention due to its scientific approach and robust technology. Founded by Charles Hoskinson, one of Ethereum's co-founders, Cardano aims to provide a more secure and scalable infrastructure for decentralized applications (dApps) and smart contracts. This article delves into the technical analysis of Cardano's price movement and market behavior as of August 2024.
Price Performance Overview
As of August 2024, Cardano's price has experienced notable volatility. The ADA token has recently shown both upward and downward trends, reflecting broader market dynamics and specific project developments.
Support and Resistance Levels
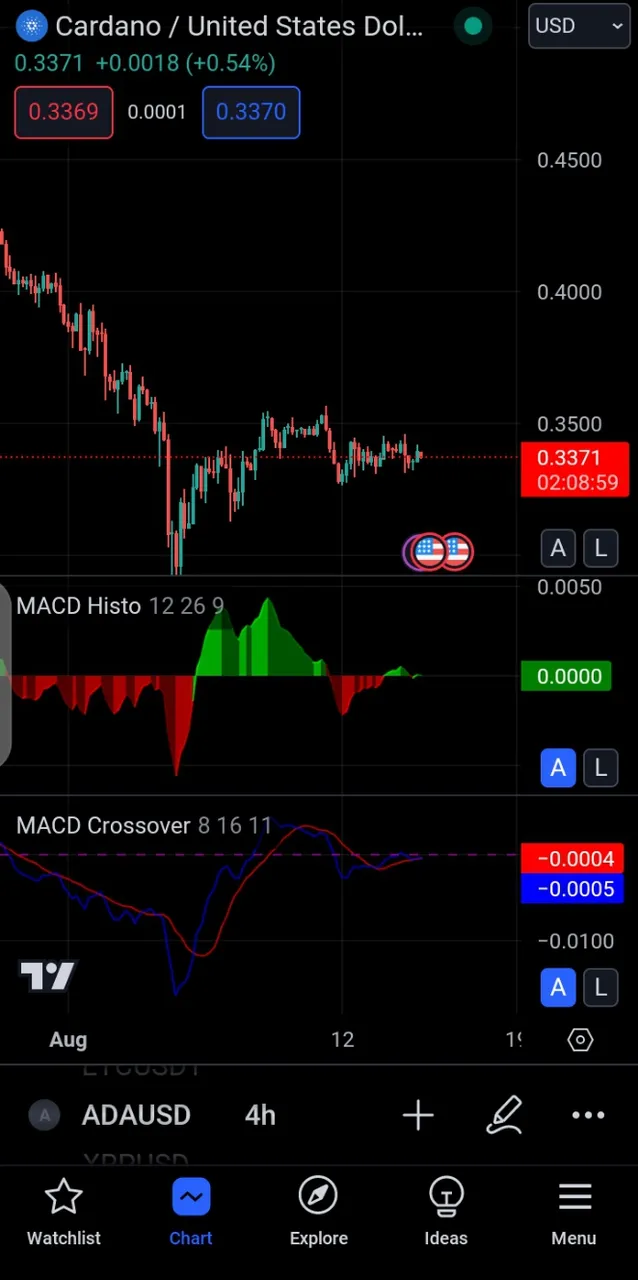
Support Levels: Cardano has shown strong support around the $0.30 to $0.35 range. This level has been tested multiple times over the past few months and has held, indicating a significant demand zone where buyers are likely to step in. A breach below this support could signal further downside potential, testing lower levels such as $0.25.
Resistance Levels: On the upside, ADA faces resistance around $0.50 to $0.55. This area has been a challenge for ADA to break through, as it coincides with a recent high and represents a psychological barrier for traders. Overcoming this resistance could open the door for a potential rally toward the $0.60 to $0.65 range.
Technical Indicators
- Moving Averages: The 50-day moving average (MA) and 200-day MA are crucial indicators to watch. Currently, the 50-day MA is trading slightly above the 200-day MA, suggesting a potential bullish crossover if the price continues to rise. Conversely, if the 50-day MA begins to trend downward, it may signal a bearish trend.

Relative Strength Index (RSI): The RSI, a momentum oscillator, is currently hovering around the 45-50 level. This indicates that ADA is neither overbought nor oversold but is approaching a neutral zone. Traders should watch for RSI to move into overbought (above 70) or oversold (below 30) conditions for potential entry or exit signals.
MACD (Moving Average Convergence Divergence): The MACD line recently crossed below the signal line, suggesting a bearish trend. However, if the MACD starts to converge and crosses back above the signal line, it could indicate a reversal and potential upward momentum.
Volume Analysis
Volume has been relatively stable but shows increased activity during price breakout attempts. Higher volume on price increases supports bullish trends, while increased volume during declines indicates strong selling pressure. Monitoring volume trends can provide insights into the strength of price movements and potential trend reversals.
Conclusion
Cardano's technical outlook shows a mixed picture with key support and resistance levels in play. The 50-day and 200-day moving averages, along with RSI and MACD indicators, offer crucial insights into potential future price movements. Traders should keep an eye on these technical indicators and volume trends for signals that may influence ADA's price direction.
As always, it's important to consider these technical factors alongside fundamental analysis and broader market conditions to make well-informed investment decisions. Don't Yolo your cash if you're not 100% convinced.
I'll catch you on the next one. Have a wonderful week.