Citizen Science Entry 4
Now, for episode 4 of @lemouth's citizen science project. This is gonna be a long post where I focus heavily on the homework questions. Bear with me :)
Task 1 and 2 proceeded quickly. Here are the results.
$ cd ~/physics/madanalysis5 # Task 1 - Event content
$ ./bin/ma5
ma5>import ANALYSIS_0/Output/SAF/_defaultset/lheEvents0_0/atlas_pp_tt.lhe.gz as ttbar
ma5>set ttbar.xsection = 505.8
ma5>set main.lumi = 140
ma5>plot NAPID # 1
ma5>submit
ma5>                        # Task 2 - Lepton and photon multiplicity
ma5>define l = l+ l-
ma5>plot N(l) 5 0 5 # 1
ma5>select (l) PT > 20      # CUT: Select leptons (transverse momentum > 20 GeV).
ma5>plot N(l) 5 0 5 # 2
ma5>resubmit
ma5>plot N(a) 5 0 5 # 3
ma5>select (a) PT > 20      # CUT: Select photons (transverse momentum > 20 GeV).
ma5>plot N(a) 5 0 5 # 4
ma5>resubmit
And here's my graphs associated with each of the plots above (before / after).
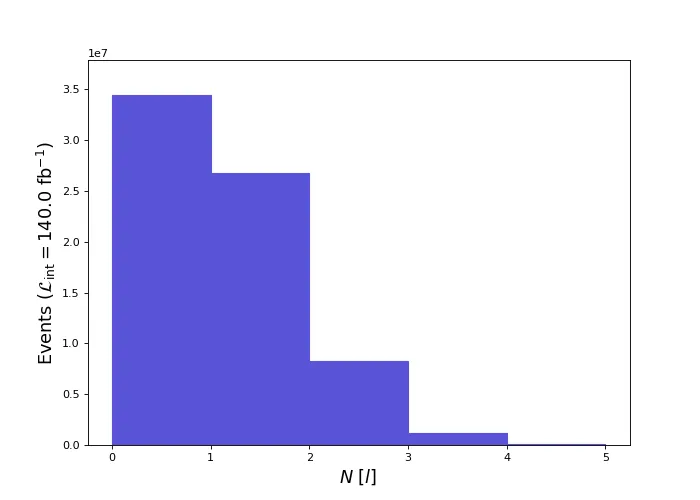
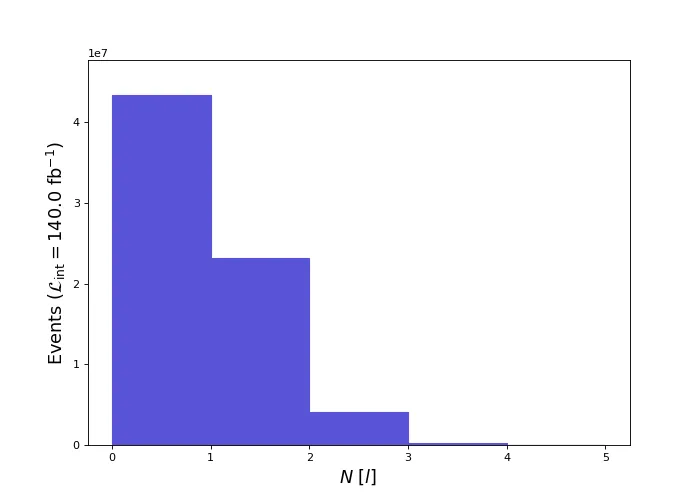
(lepton multiplicity. Top: before cut. Bottom: after cut)
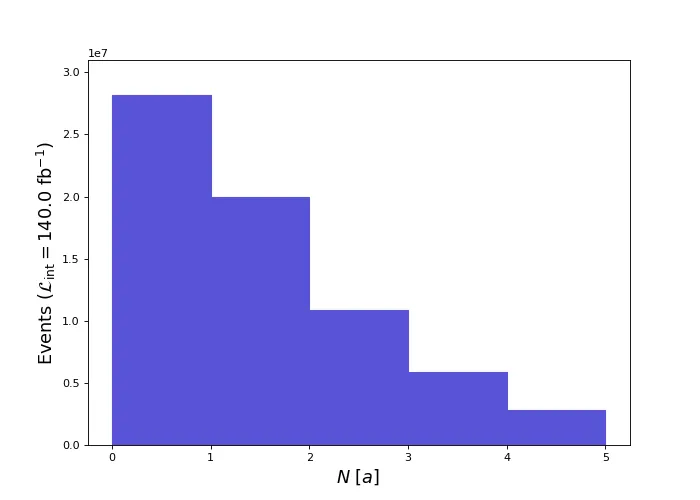
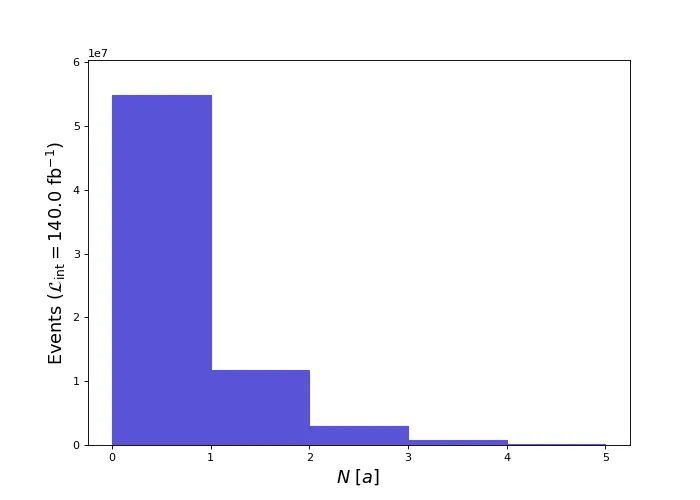
(photon multiplicity. Top: before cut. Bottom: after cut)
Homework 1
Homework 1 asks us to determine the multiplicity of jets ('j') and b-jets ('b') after applying a 25 GeV cut. The process is similar to the 20 GeV cuts in task 2. Here's the procedure I used:
ma5>plot N(j) 12 0 12 # 5
ma5>select (j) PT > 25
ma5>plot N(j) 12 0 12 # 6
ma5>
ma5>plot N(b) 4 0 4 # 7
ma5>select (b) PT > 25
ma5>plot N(b) 4 0 4 # 8
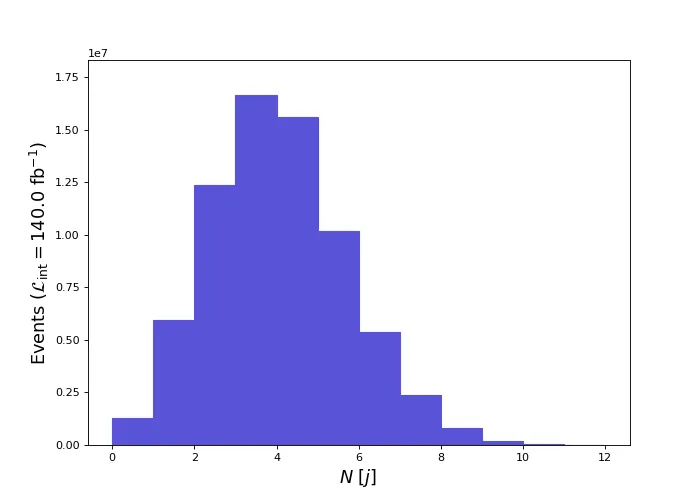
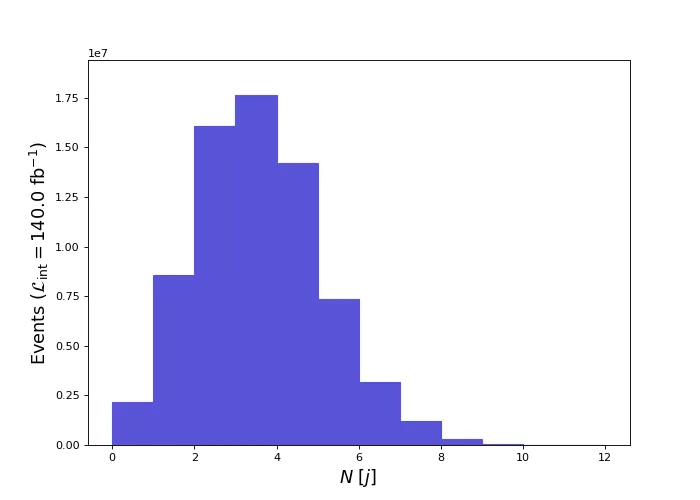
(jet multiplicity. Top: before cut. Bottom: after cut)
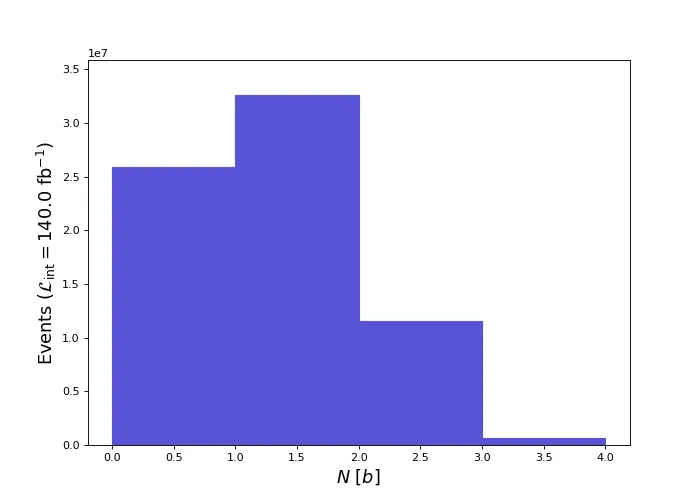
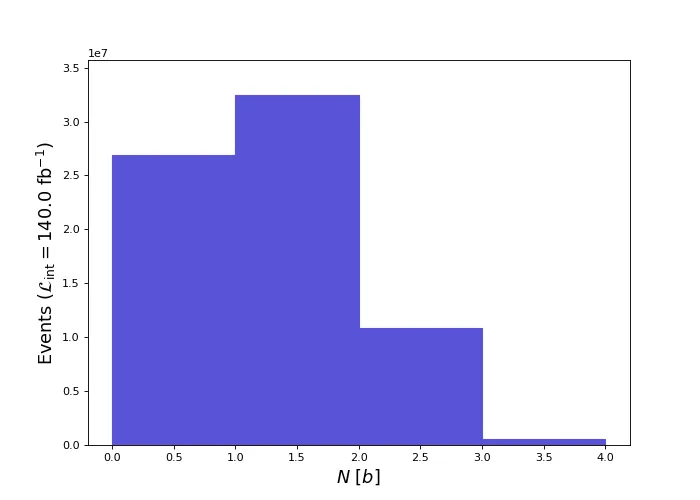
(b-jet multiplicity. Top: before cut. Bottom: after cut)
Process notes
Here's some process-oriented notes and findings. No physics.
To see the entire multiplicity distribution, as @lemouth mentioned, we needed to change the lower and upper horizontal limits of the histogram. Through trial-and-error I selected [0, 12) for jets and [0, 4) for b-jets. The Mean, RMS, underflow and overflow, as printed in the output PDF, were very helpful in determining appropriate horizontal values.
I also found myself retyping commands in MadAnalysis5 quite a bit. As it turns out, scripts are available in MadAnalysis5! These scripts are plain-text files that contain a list of commands to execute in the interpreter. The syntax to run a script file is:
$ ./ma5 <script>
As an aside, I've been prefixing each MadAnalysis5 command with 'ma5>'. From here on I'll dispense with that convention.
Moving on, I found myself asking another question when looking through the PDF files. What do the '% underflow' and '% overflow' mean? My guess was that these percentages indicate the amount of data that is not graphed. Either to the left (underflow) or right (overflow) of the histogram. To test this theory, I ran:
plot N(j) 4 0 4     # Guess: overflow. Result: 37.19% overflow and 0.0% underflow.
plot N(j) 8 4 12    # Guess: underflow. Result: 62.81% underflow and 0.0% overflow.
Which seems to verify my guess. I sliced the dataset in to 2 disjoint subsets. The first subset has samples containing 0 to 3 jets. The second 4 to 12 jets. Adding the overflow and underflow from both, respectively, results in 100% (overflow + underflow = 37.19% + 62.81% = 100%).
As to why less b-jets are cut
Lemouth posed the question as to why the distribution of b-jets didn't change much after the 25 GeV cut. This implies that the majority of b-jets have a transverse momentum greater than 25 GeV. It took me a while to come up with a hypothesis, and here's how my thinking got started:
These high energies are likely a result of the simulation process we ran in Episode 2. To recap, we simulated proton-proton collisions that produce a top and anti-top quark. Since the top and anti-top quarks decay almost instantaneously, our data consists of simulated signals left by their decay products, not the quarks themselves. These decay byproducts are 2 b-quark's and 2 W bosons. So we should have two b-jets in each collision (and since simulated detection efficiency is not perfect, we don't usually see two b-jets in the 'plot N(b)' histogram above). It's then reasonable to assume any detected b-jet would have higher energy due to the collision process that we simulated. But does the b-quark inherit the momentum from the collision (and therefore from the top-quark)? And is there more momentum transfer along the vector of the collision beam?
Can I test whether there are higher energies parallel to the beam? Perhaps the particles with a pseudo-rapidity near 0 (perpendicular to the proton beam) would have lower transverse momentum? Let's try to figure it out.
I cut using select (b) ABSETA < 1.0 and generated a graph of the transverse momentum of b using plot PT(b) 25 0 255 [logy]. The mean energy of PT(b) with ABSETA(b) < 1.0 was 89 GeV. In another session I recut using select (b) ABSETA >= 1.0 and replotted. The mean of PT(b) was 83 GeV.
Well, there goes my theory of momentum transfer being greater in a direction parallel with the beam. The relationship between direction and momentum transfer, if it even exists, may be opposite what my intuition tells me. Anyways, it's clear there's energy transfer, but how? It turns out I was too 'elastic' in my thinking.
Further investigation led me to this. It appears that the proton-proton collision is largely inelastic with much of the proton's kinetic energy used to 'convert' the interacting protons into very massive top quarks. It's likely most of the energy in the decay byproducts come from the decay process itself, not from any residual velocity the protons had (This is also a good reference).
What does this have to do with b-jets? Based on the decay of a top-quark, the b-jets must have a good amount of energy. A b-quark's mass is 4 GeV while a W boson is 80 GeV. Given that a top quark's mass is 173 GeV, there's nearly 90 GeV unaccounted for. That energy must go somewhere due to the conservation of energy. This energy is likely transferred to both the b-quark and W boson via extra momentum (another good reference is nuclear decay and conservation laws).
So my current hypothesis is that our b-jets are high-energy due to the decay process of top quarks. Top quarks that were created by the inelastic collision of 2 protons.
Homework 2 (and Task 3)
Oh. Hey, we can gather subsets of the generated collisions! In this case we select for the production of exactly one detected lepton: select N(l)==1. After making this cut I verified my efficiency was near that of Lemouth's (mine was 33%).
Here's the command I entered to visualize the effects of the cuts:
plot N(l) 5 0 5 # 9
Here's the resulting lepton multiplicity graph:
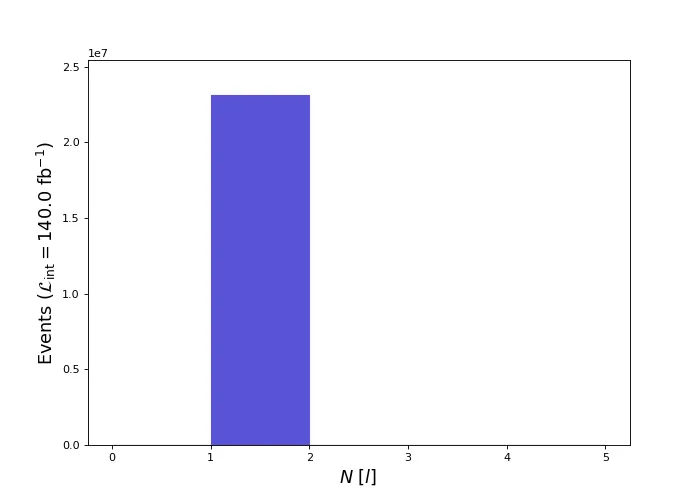
This plot of the multiplicity of leptons is to be expected and acts as a good verification. We only have events with one lepton in them, which is good! It's exactly what we asked for.
Task 4
Here's the commands for task 4.
plot PT(l) 25 0 200 [logY] # 10
plot ABSETA(l) 25 0 2.5 [logY] # 11
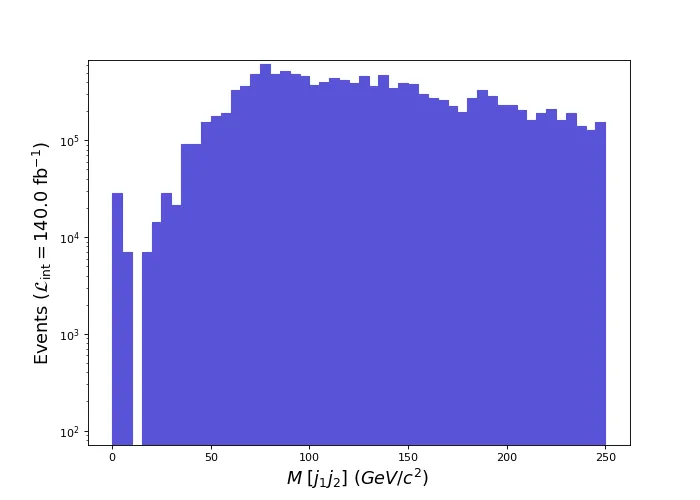
plot M(j[1] j[2]) 50 0 250 [logY] # 12
I include only the plot of the mass of both jets. The other plots look like lemouth's:
Homework 3
Here's the commands and resulting graphs (graphs are given in the same order as command execution):
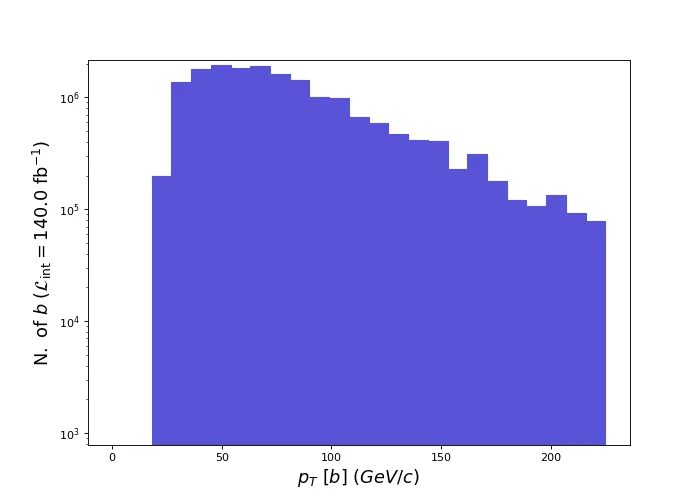
plot MET 25 0 225 [logY] # 13
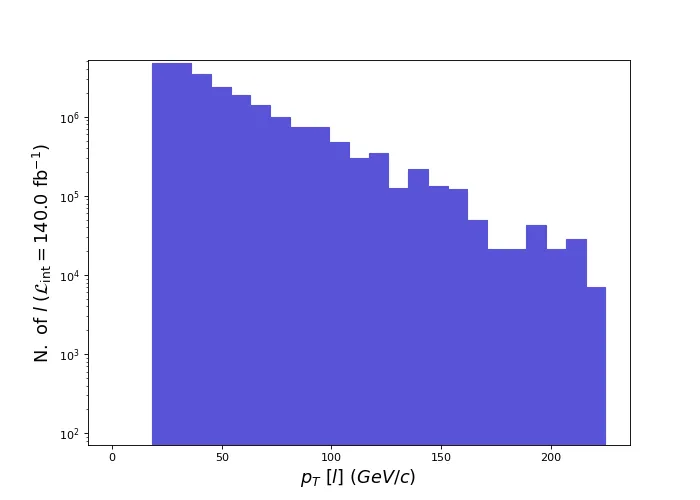
plot PT(l) 25 0 225 [logY] # 14
plot PT(b) 25 0 225 [logY] # 15
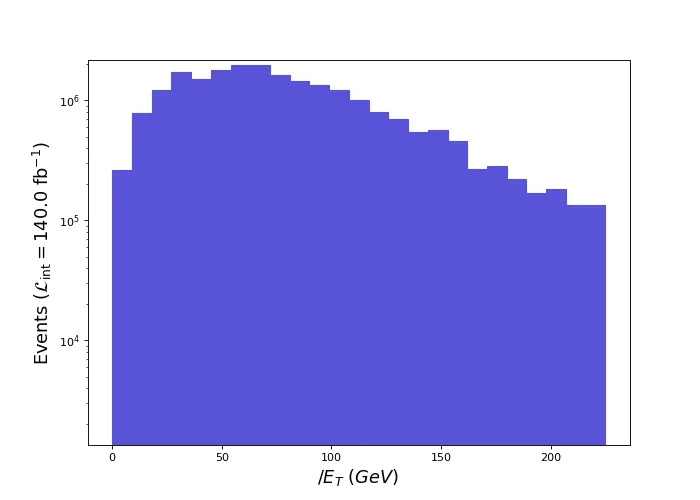
For homework 3, lemouth asks whether or not the MET plot makes sense and why. I wager that the majority of the missing transverse energy emerges as the result of neutrino emission. Two neutrino emissions to be exact.
Initially I didn't know if the chart of missing energy made sense. It wasn't until I was looking at the process of top-quark decay that it dawned on me. Now I think the histogram of MET makes sense, and here's why.
Previously we plotted PT(l). And we know only one lepton is emitted during the process because we made a cut for one lepton. From the plot we know the mean energy of PT(l) is 52 GeV. Knowing the energy of our lone lepton leaves us with two unknowns: the energies of the neutrino and b-jet.
Finding the b-jet energy is straightforward: plot PT(b) 25 0 255 [logY] which yields a mean energy of 86 GeV. Initially I thought I should select for events that contain two b-jets only, then select b[1]. But it turns out plotting 'PT(b)' returns values on a per-jet basis (not all the energies of the b-jets summed together).
The harder energy value to understand was MET itself (77 GeV). I clearly can't add the lepton, b-jet, and MET energy to get the energy of a single top-quark. The arithmetic doesn't work: 52 + 86 + 77 = 215 GeV. Whereas the top quark is 172 GeV.
While staring at the plot of top-quark decay it occurred to me that MET doesn't represent the energy of one neutrino, but two! The other top-quark decay also emits a neutrino! And that is also included in MET as total missing energy. So, dividing MET by 2 yields: 77/2 = 38. Then 52 + 86 + 38 = 176 GeV! That's very close to the known energy of a top quark (172 GeV). Maybe I just got lucky in the calculation, but that's my justification for MET.
And that's all folks!
Wow! This was a long update. The whole process took me about 3/4 of a day. And most of that time was spent trying to figure out the homework questions. But it was great fun.
Until next time!
P.S. I apologize about the alternating size of plots in this post (especially for the before/after images). I'm not sure what's going on as all the images are the same size.