Citizen Science Entry 3
Now, for episode 3 of @lemouth's citizen science project. Still chuggin' along.
Today, we'll be using the MadAnalysis5 software package to simulate detectors at the LHC. We ingest our simulated pp collisions, generated in episode 2, through a simulated detector (ATLAS).
Here's the steps I took to complete the task:
$ cd ~/physics              # Task 1
$ git clone https://github.com/MadAnalysis/madanalysis5
$ cd madanalysis5
$ pip install matplotlib    # Task 2
$ pip install scipy
$ sudo apt-get install texlive
$ sudo apt-get install texlive-latex-extra # Alleviates errors generating PDF/DVI files.
$ ./bin/ma5
ma5>install fastjet
ma5>exit
$                           # Task 3
$ ./bin/ma5 -R madanalysis/input/ATLAS_default.ma5
ma5>import ~/physics/MG5_aMC_v2_9_9/pp_tt/Events/run_01_decayed_1/tag_1_pythia8_events.hepmc
ma5>set main.outputfile = atlas_pp_tt.lhe.gz
ma5>submit
ma5>exit
$ ./bin/ma5                 # Task 4
ma5>import ANALYSIS_0/Output/SAF/_defaultset/lheEvents0_0/atlas_pp_tt.lhe.gz as ttbar
ma5>set ttbar.xsection = 505.8
ma5>plot NAPID
ma5>submit
That's roughly it. I checked both the output MadAnalysis5 PDF files and images and here's the resulting histogram of particle counts:
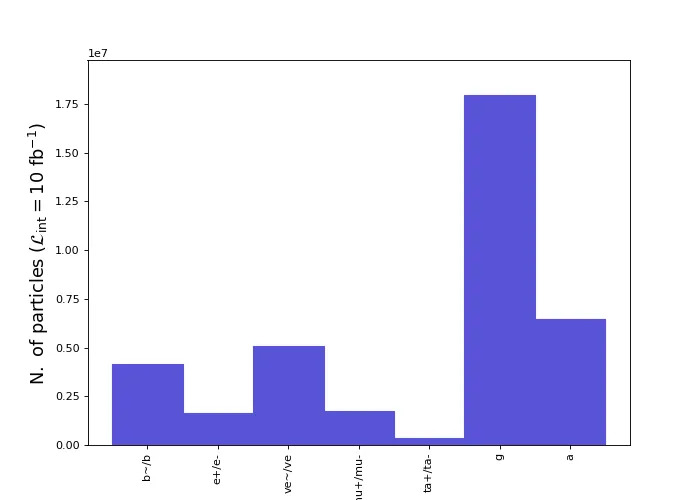
It has roughly the same distribution as @lemouth described in episode 3.
This has been a short update and I'm looking forward to diving more into the physics in episode 4. All in all, it took me just a few hours to run the steps above and write the post.
See all of yall around!