Background
@shrazi invited me to participate in CBRS infographic contest. To create a good infographic design it was necessary to know Hive in detail and I have only joined Hive for 3 months. But still I accepted the challenge.
CBRS Infographic Contest
I realized that CBRS Infographic Contest is a great opportunity for me to learn more about the Hive. I was able to see how different parts of the ecosystem work together and how they are interconnected. This gave me a better understanding of the overall ecosystem and how it functions.
My Idea for an Infographic
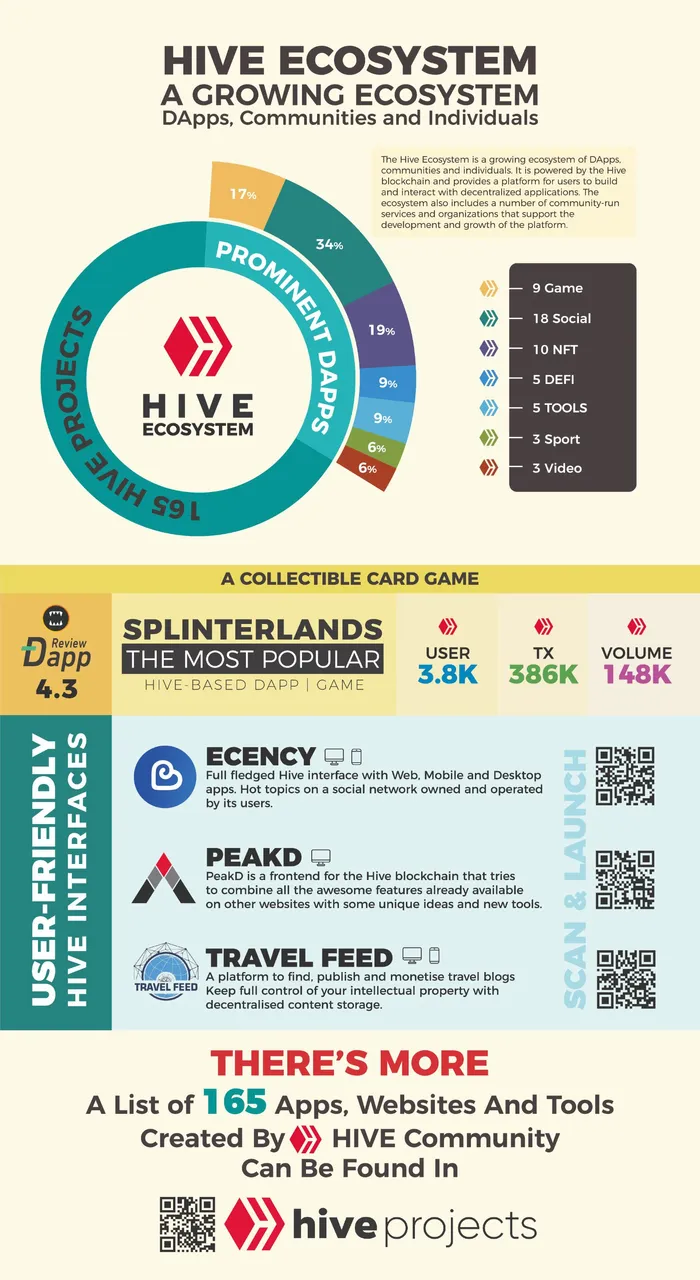
When I first saw the CBRS infographic contest, I was excited to participate. I thought Hive Ecosystem infographic would be a great way to help others understand it better. After doing some research and thinking about what would be most helpful, I came up with the following idea for an infographic:
Prominent Daaps
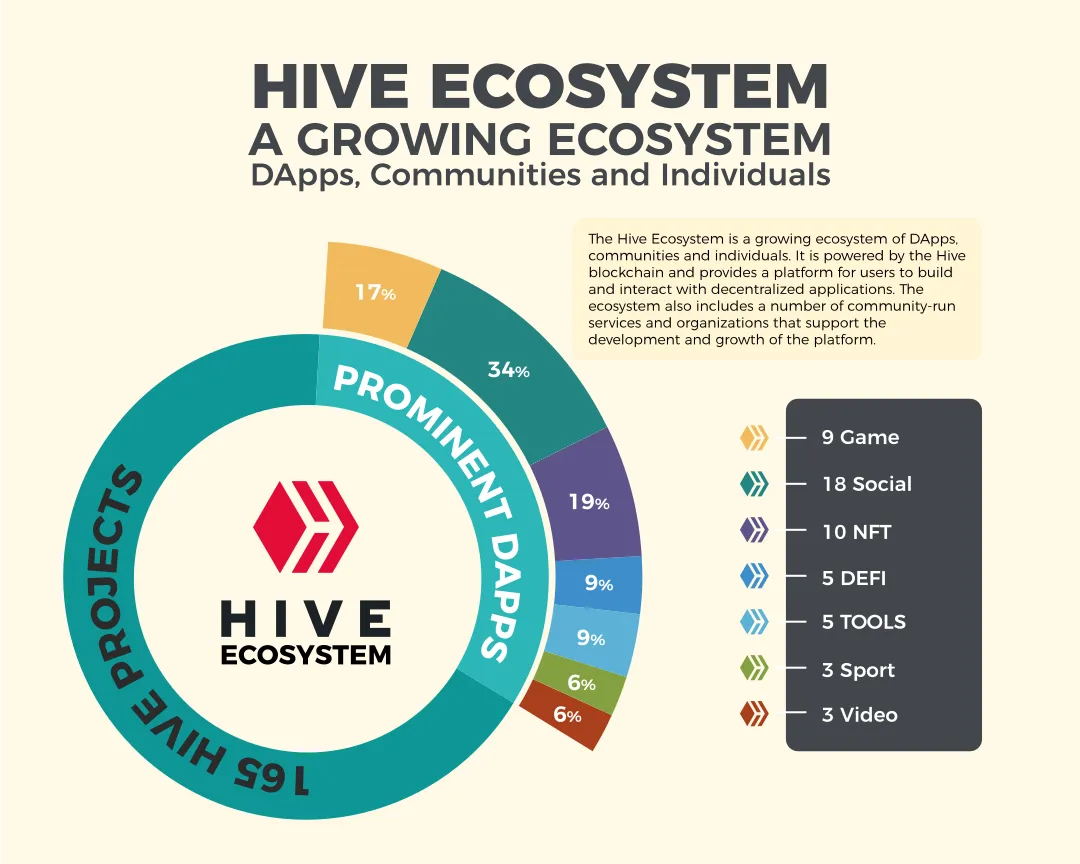
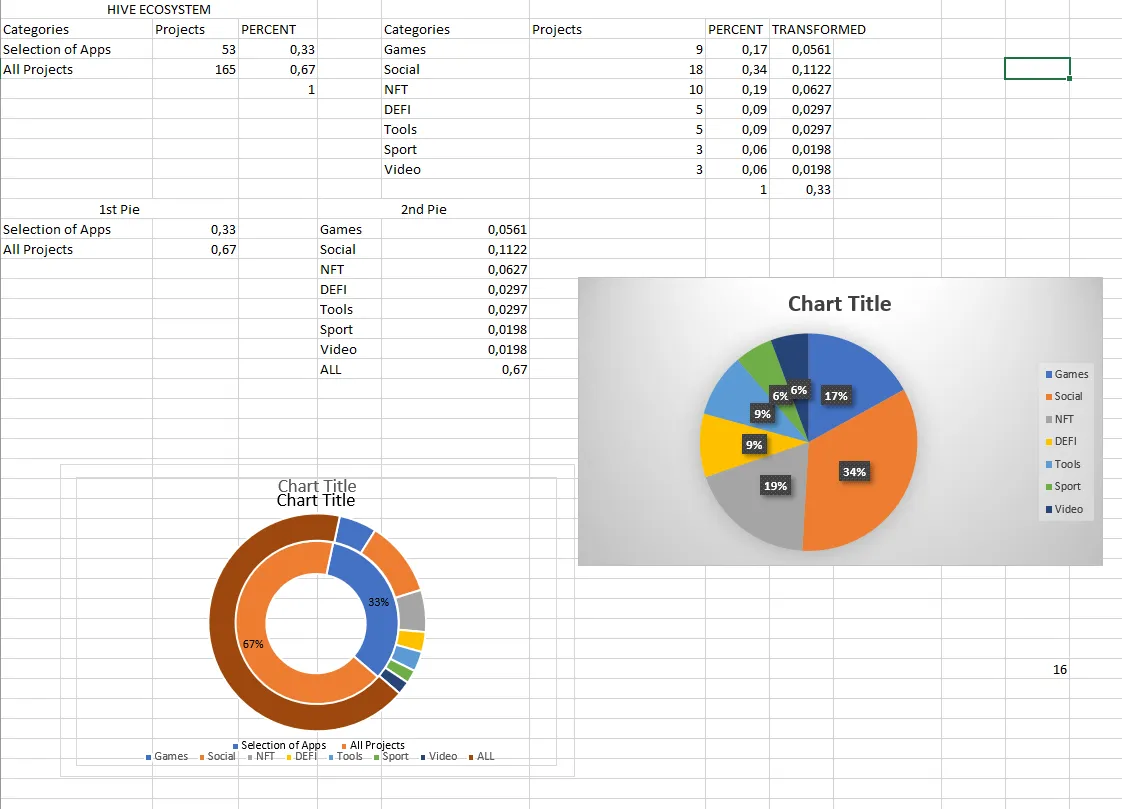
The main focus of the infographic is on the various projects of the Hive ecosystem. Out of a total 165 Hive projects, I highlighted 53% of prominent Dapps in light green color. Each project category is displayed in different colors. The category of each project and the number of projects in that category are displayed. These are what provide users with actual value and utility within the ecosystem.
Splinterlands - The Most Popular Hive-based Game
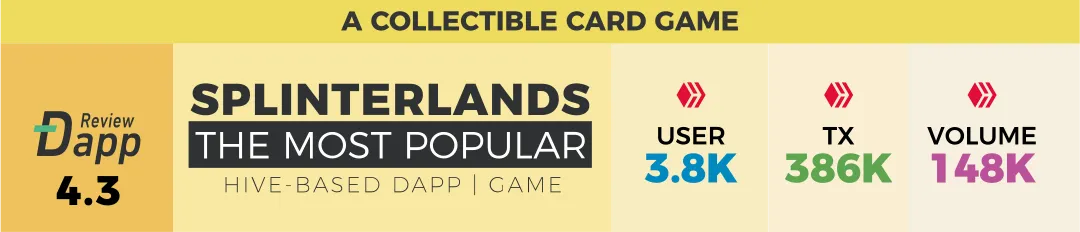
In next section i added the most popular hive based collectible card game with its rating, users and other data.
Hive Interfaces
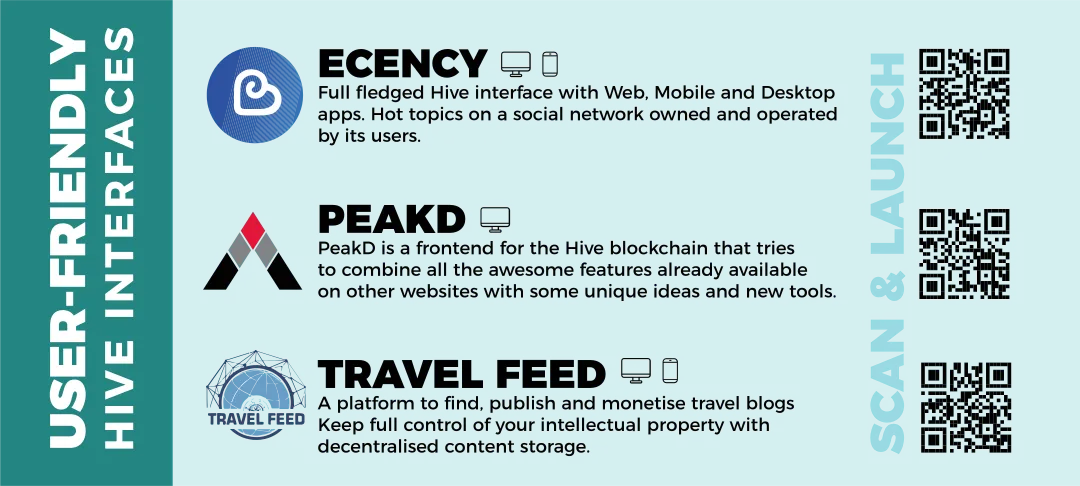
The third section is about the three front-ends I use. A QR code is also provided with each interface to be scanned to access the website directly.
Hive Projects
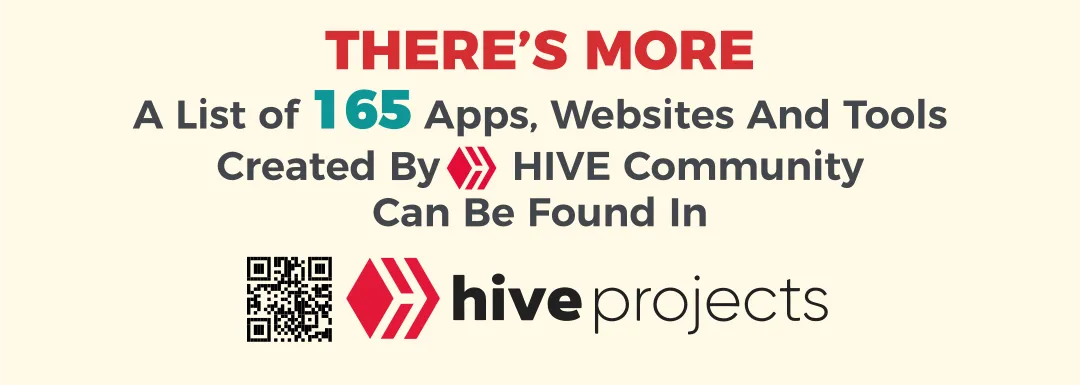
And the last part is my attempt to direct the people who want to know about all Hive projects.
***Disclaimer*** As I mentioned in my intro, from the last 2 decades I have been active on social media, google mapping and reviews, youtube and thatsup. I will share my own past interesting content from these channels, but all my upcoming content I will share on hive.blog first.