An easy one to read:)
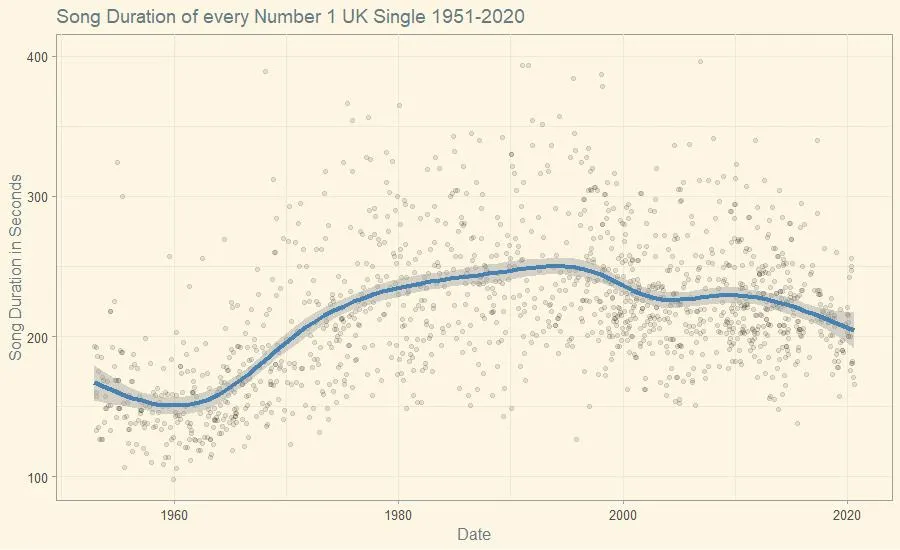
This visualization shows the duration of every Number 1 UK Single, from 1951 to 2020.
If you like the data but don't love the visualization, Luke Turvey, the author, added everything needed in his Github repository :)
I would follow me for a #visualization post every Monday.
PS: I'm preparing something different for next Monday ;)
Don't forget to follow me LinkedIn too!