The Hive internal DEX is an amazing feature on the Hive blockchain. It is a layer one DEX that allows users to trade HIVE and HBD. Imagen if BTC or ETH had an on chain, layer one - no additional apps, KYC free, permissionless way to convert between a stablecoin and the asset. It’s quite the thing!
Background generated with Midjurney
The DEX has been around since the beginning of the chain, and it is an integral part of it. However, it has always been underutilized and with low volume. But since the introduction of the two ways conversions and more HBD improvements, things have changed, especially in the last two years. Much higher volumes and usability of the DEX. Also, now we have more than one interface for the DEX.
The @hbdstabilzier is trading on the internal DEX. In a way it’s an incentivized market where it tries to keep the price of HBD at the peg. If the price of HBD is lower than the peg, the stabilizer buys HBD, and if it is higher, it sells HBD. Doing this the stabilizer provides instant liquidity for HBD, that sometimes can be an issue, because the conversions last 3.5 days and have a market risk in them.
Since May 2023, the stabilizer has scaled back its budget from a daily 200k HBD that it previously had to 24k HBD now. This is quite the reduction in liquidity, and it leaves space for other players to step in. Let’s see how this has affected the trading on the Hive DEX.
Here we will be looking at:
- Daily HBD volume on the internal Hive DEX
- Monthly HBD volume on the internal Hive DEX
- Number of trades made
- Number of accounts trading on the DEX
- Top liquidity providers on the DEX
- HBD Price
The period that we will be looking at is from 2021 till now. This is because in 2021 the two ways conversion for HBD was introduced and the stabilizer trading on the DEX. Prior to this the volume and the activity are very low.
Daily Trading Volume
Here is the chart for the daily trading volume on the internal Hive DEX.
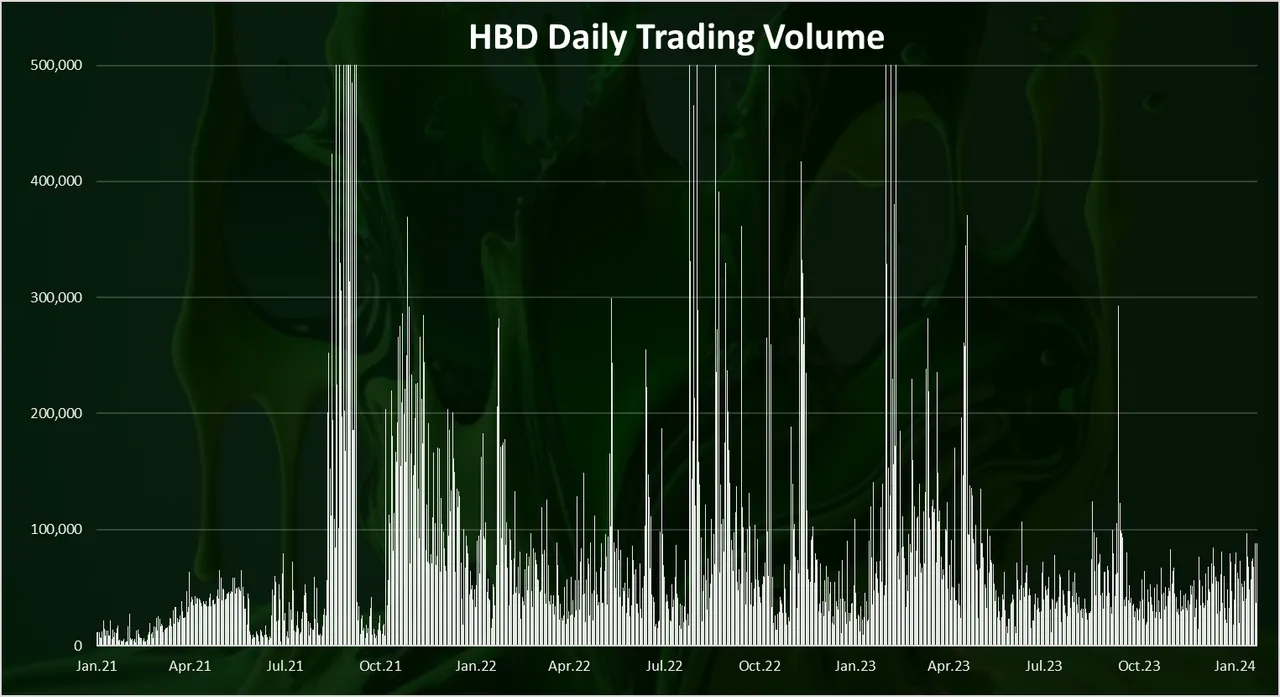
This is a longer timeframe starting from 2021, for context. As we can see back in the begging of 2021 the daily trading volume is quite low, usually under 5k. The stabilizer was introduced at the end of February 2021, and later we can notice the increase in the trading volume on the DEX. Furthermore, in June 2021, the HIVE to HBD conversions were implemented and we can see the explosion in the trading volume in August 2021. This is as a result in the increase in the price of HBD and all the arbitrage that has been undergoing.
We can notice the spikes in the trading volume on a daily basis in 2022 and 2023. This usually happens when HBD is trading higher on external markets, usually on Upbit where HBD has one of its rare listings. When this spikes happen the trading volume on the internal DEX is higher than 1M HBD per day.
When we zoom in 2023 we get this:
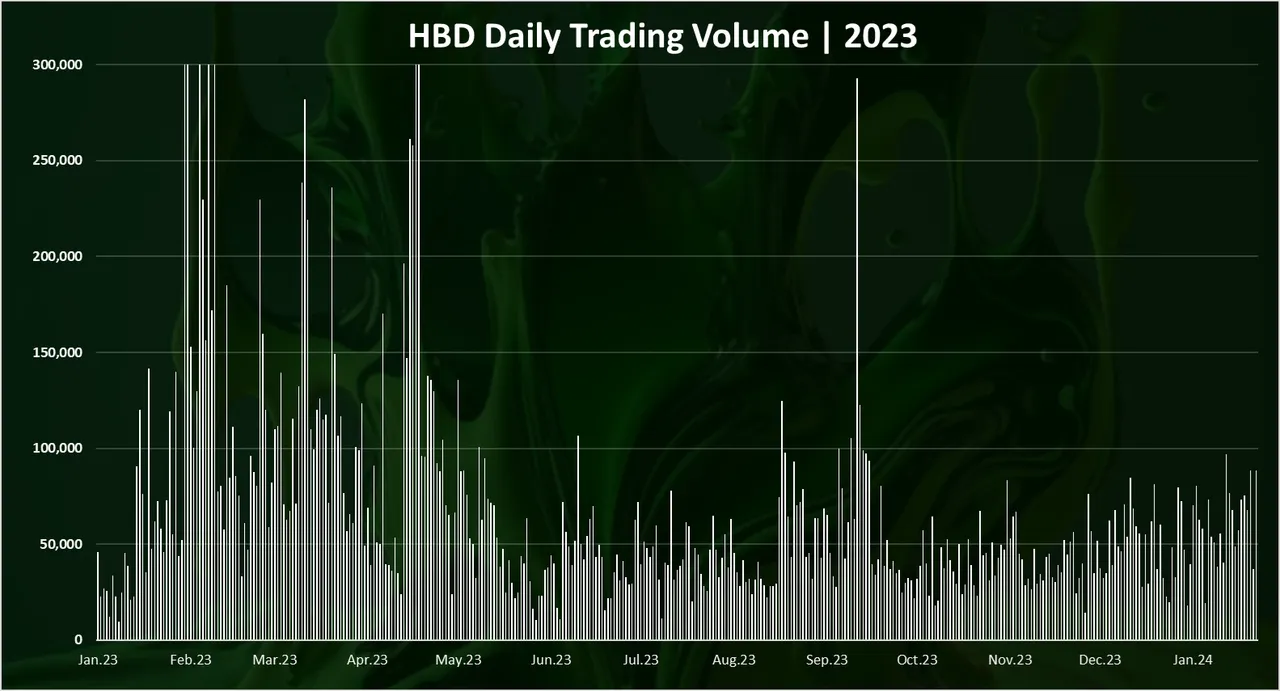
We can notice a downtrend since May 2023. The reduction in the daily budget had obviously impacted the trading volume. But we can also notice an increase in September-October 2023 when there was more market volatility and a slow increase in the last months starting from December and entering in January 2024.
Up until May 2023, the average daily volume on the DEX was around 100k HBD. After May we have seen a drop to around 50k daily trading volume on the DEX. But as we can see the market activities can push the trading volume up again even with a low budget from the stabilizer. In the last month we can see that the trading volume has grown again to around 100k per day. This time its mostly coming from other players, not the stabilizer itself.
The monthly chart for the trading volume on the DEX looks like this:
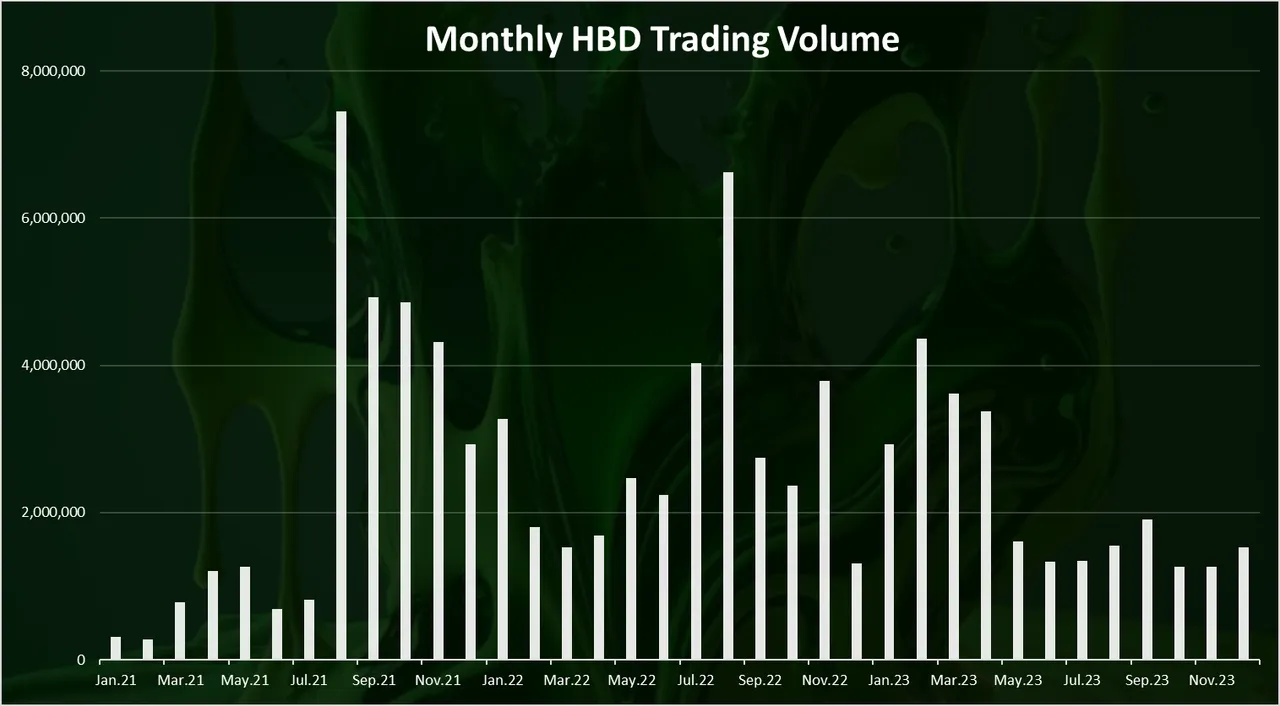
Here we can see the spikes in the monthly volume chart. First in August 2021 up to 7.5M, then again a year later in August 2022 to 6.5M.
In 2023 in the first months the trading volume was around 3.5M HBD, while after May and the scaling back of the stabilizer, the monthly trading volume has been in the range of 1.5M up to 2M.
Number of Trading Operations
The above was the volume. What about number of operations/trades made on the DEX. Here is the chart:
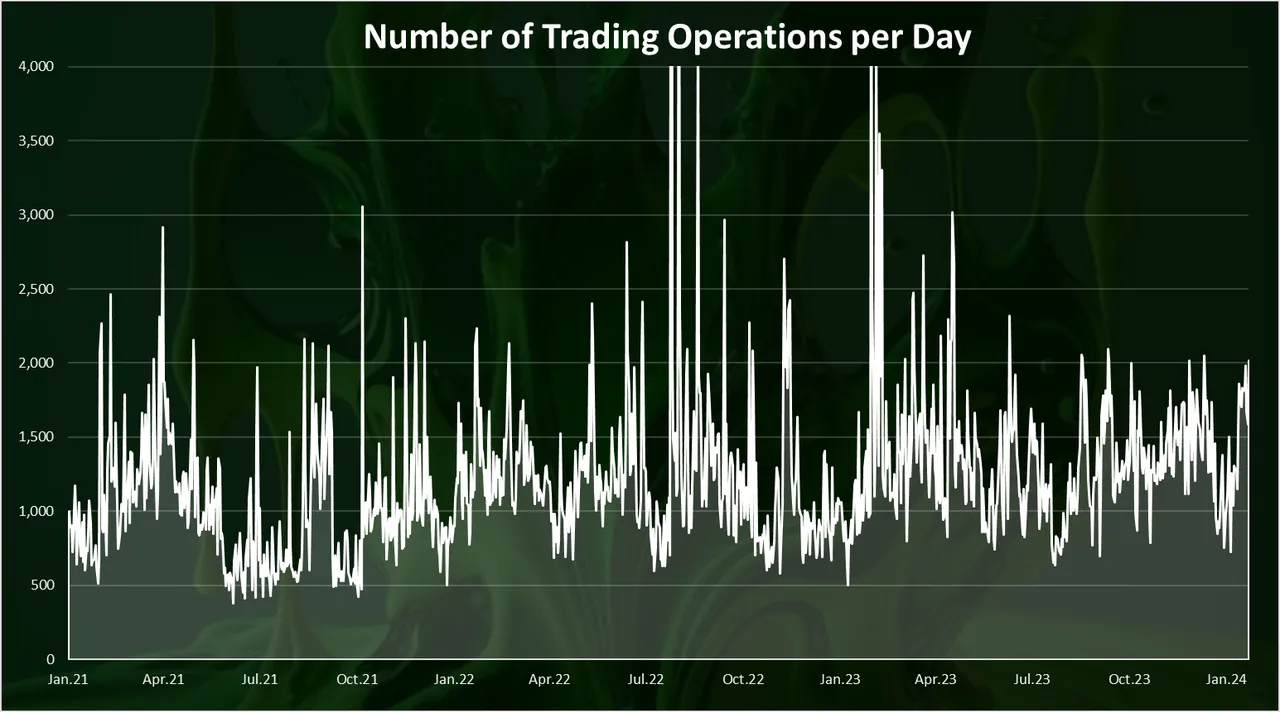
In terms of operations, we can see more constant data, with occasional spikes. Starting back from 2021, the number of trades on the DEX were in the range of 1k to 3k. There was a massive spike in August 2022 to 8k daily operations and another spike recently in January 2023. In the last period the number of daily operations on the DEX is between 1.5k to 2k.
Number of Accounts Trading on the Hive DEX
What about the number of accounts? How many users are actually using the DEX? Here is the chart for the daily accounts.
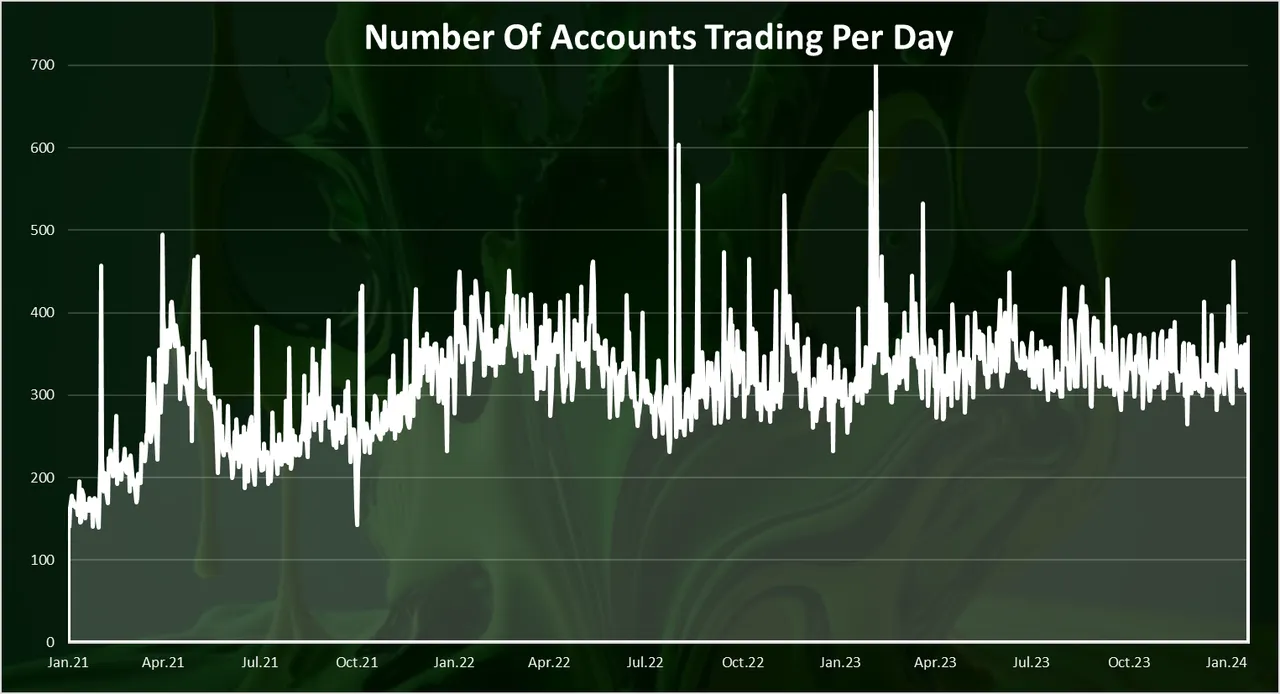
The number of accounts trading on the internal DEX has been surprisingly constant on daily basis in the last period. Between 300 to 400 accounts making using the DEX on a daily basis.
What about the number of monthly accounts trading?
When it comes to trading not everyone is doing it daily, so the MAUs might be a better indicator. Here is the chart.
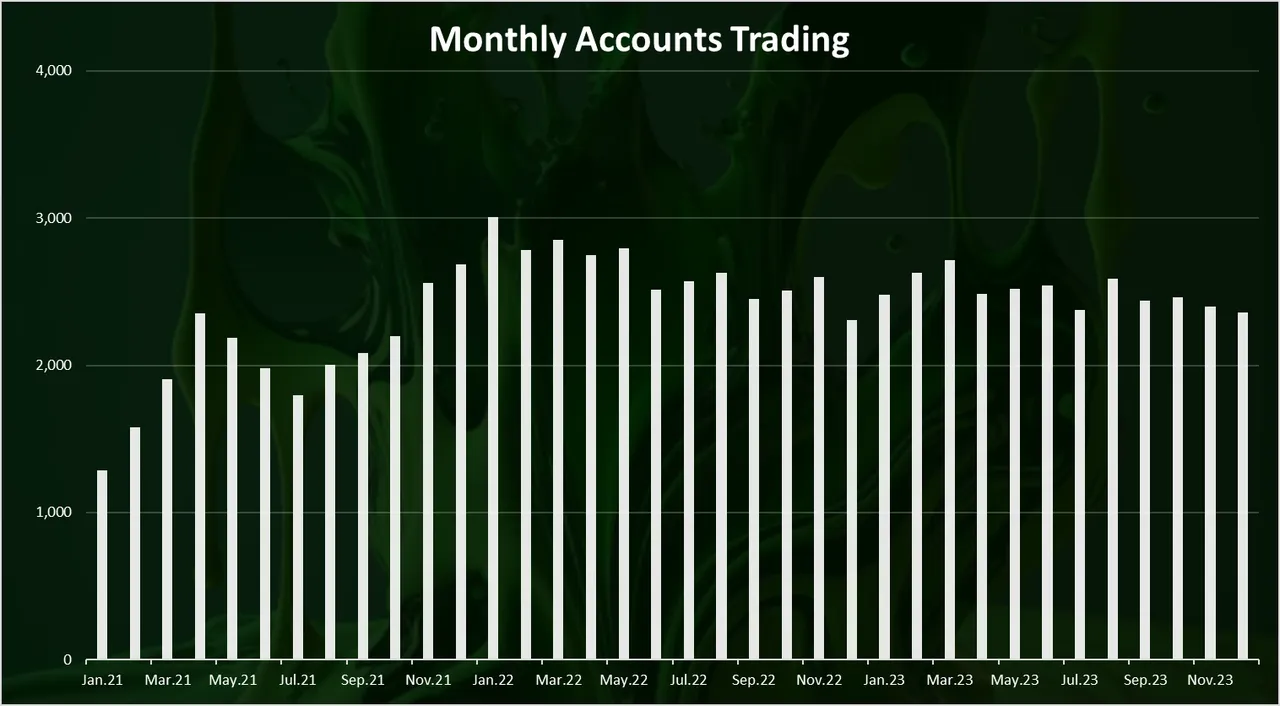
The monthly active accounts chart is also quite stable. Somewhere around 2.5k accounts trading monthly on the internal DEX. This is quite higher from the DAUs, where the daily numbers are around 300.
Top Liquidity Providers on the Hive DEX
Who is doing most of the trading? Here is the chart for the top accounts that are selling HBD on the DEX in the last 30 days.
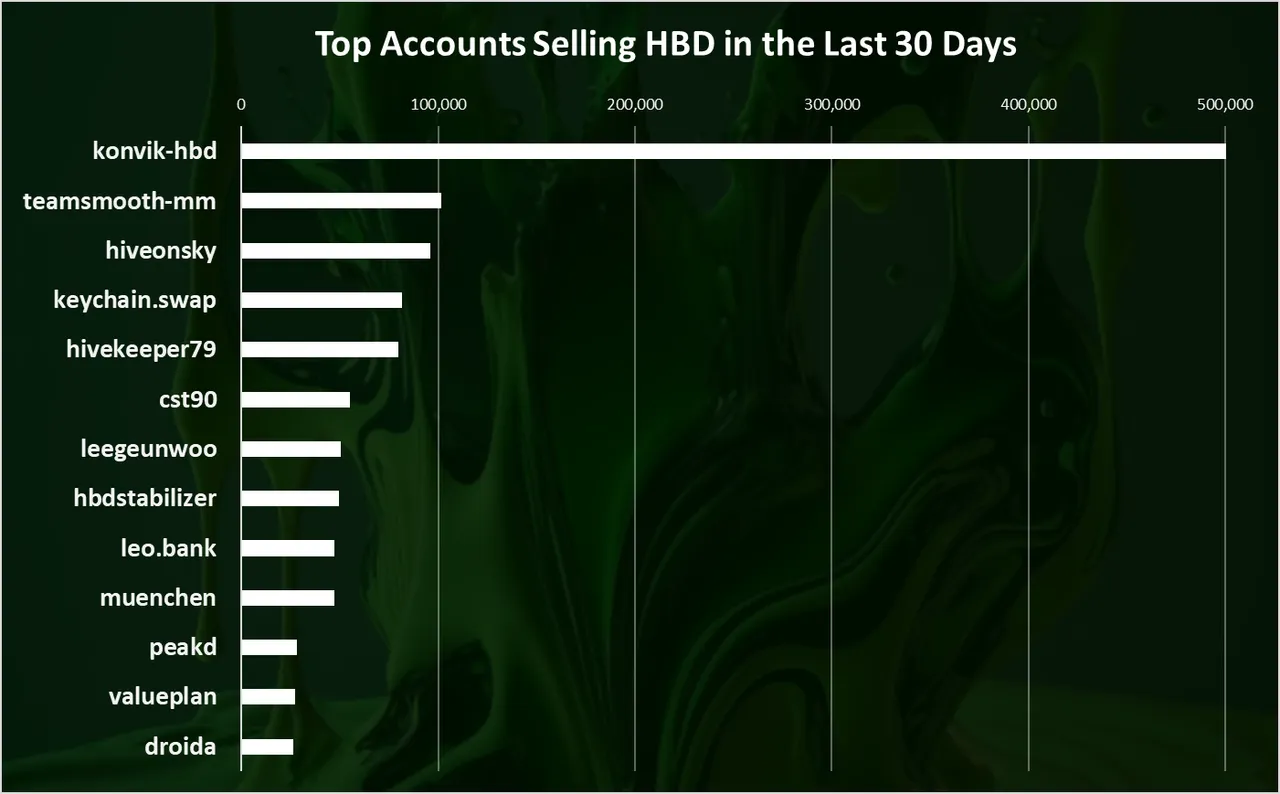
The @konvik-hbd account is on the top now with more than 500k HBD sold in the last 30 days. @konvik is now the top market maker on the hive DEX.
On the second spot is @teamsmooth-mm with 100k. Interestingly the @keychain swap account is in the top as well now, after it integrated swaps in its app. The @hbdstabilizer that was once dominating this chart is now quite low in the ranking.
What about buying HBD? Who is buying the most?
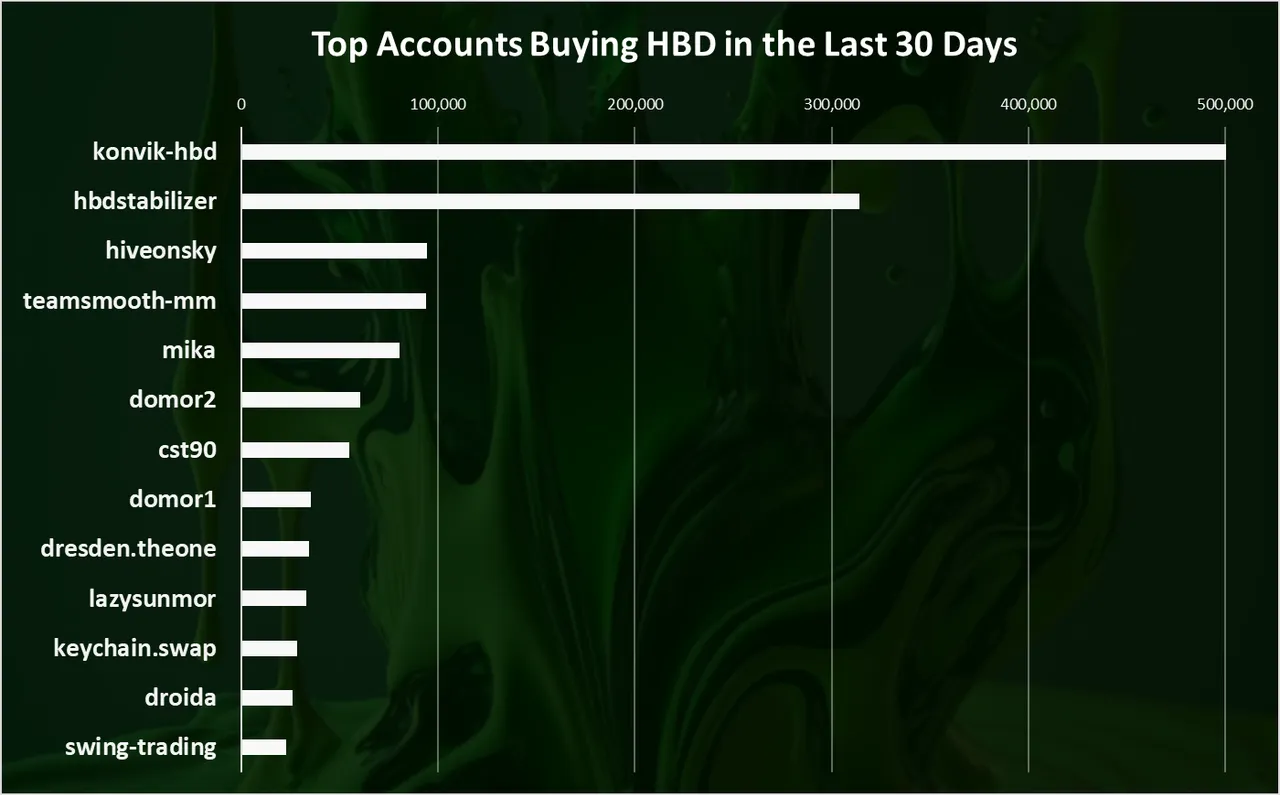
@konvik-hbd is on the top here as well with a similar amount of HBD bought as sold, just above 500k in the last 30 days. This confirms that this account is now the top liquidity provider on the DEX.
When it comes to buying HBD, the @hbdstabilizer is ranking better on the second sport with 300k HBD bought. This shows that the stabilizer has been more active on the downside for HBD providing liquidity and keeping the peg in tighter range.
HBD Price on the External Markets
At the end the chart for the HBD price starting from 2020.
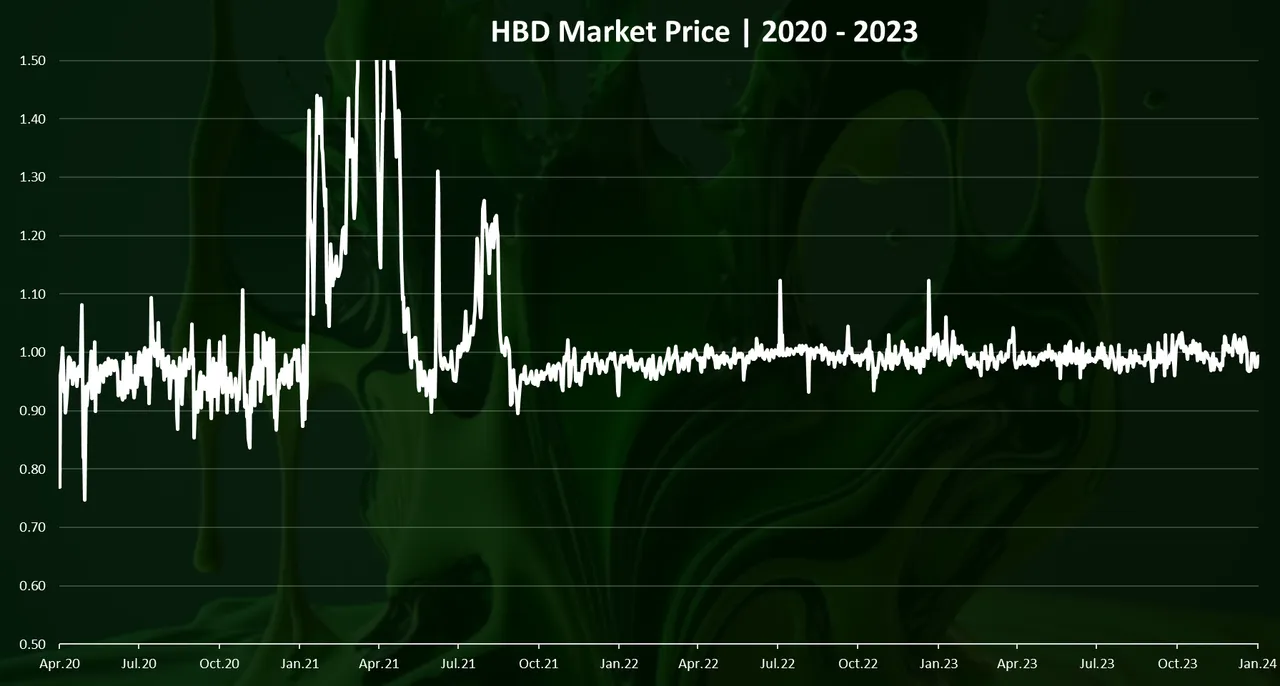
We can see that at first the price was oscillating a lot around one dollar. Then in the first half of 2021 it spiked and reached more than $2 on a few occasions.
After August 2021, the HBD price on the external markets is much more stable with a few small spikes above $1.1, and drops to around 0.95.
In the last period, after the scaling back of the @hbdstabilizer budget there has not been any significant movement in the HBD price. Other players are also participating in providing liquidity on the DEX, buying and selling HBD. This has basically removed the stabilizer as a single entity that is providing liquidity for HBD and made the system more decentralized and user driven.
All the best
@dalz