Moments of Pleasure, Years of Pain!
I got the title from of Dan's recent monologue at 3-speak. It felt original. I feel quite similarly about hive. It's lots slogging and crap most of the time punctuated by moments of absolute joy. I am going through one such phases of joy at the moment. Lately I have been analysing some hive stateholder data. This is simply because lately I am trying to encourage some splinterlands players to engage in hive. So obviously I am having to answer questions related to "hive etiquette". To understand that, and maybe the underlying behavior of hiveans in general, I started to do some data visualization.
Basically, I think I am trying to detach a person from his shadow! No clue about what I am talking about? Well you got to read Haruki Murakami's Hard-boiled Wonderland and the End of the World. Don't worry, you don't need to read and understand that book to read through this post!

Generated with AI DALL-E3 ∙ August 26, 2024 at 4:29 PM; using prompt "detach yourself from your shadow landscape image"
Top 1000 Hive Stakeholders
This is a continueation from my previous post where I analyzed the Top 200 Hive Stakeholder data. Now here is the top 1000 HP plotted with Held HP along the X-axis in log scale (I will try to keep this axis similar in all plots) and Reputation along the Y-axis. The size of the circles represents author HP.
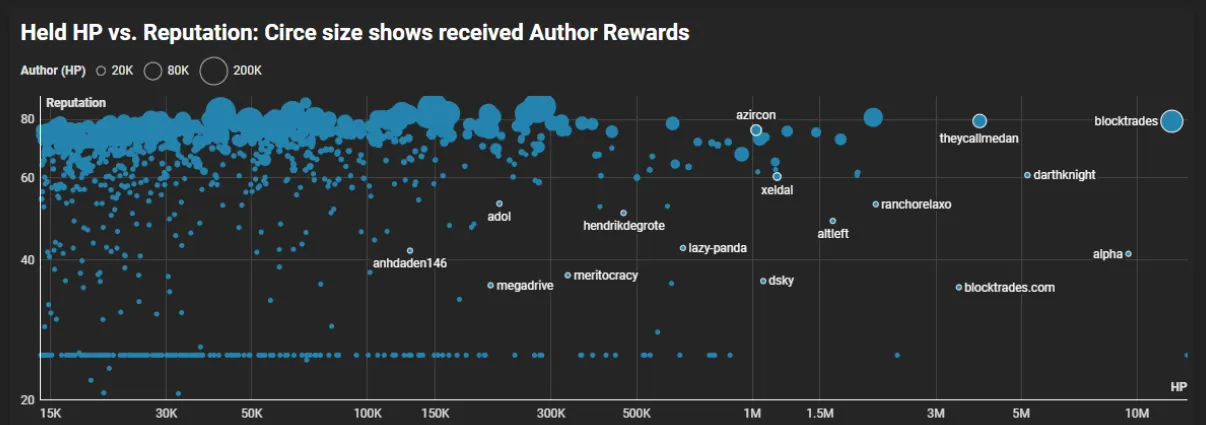
This is the overview plot. Few observations:
- Few datapoints higher than 500K HP (our Whale mark)
- Lot of data lower than 500K HP
- Data density increases the lower or more to the left along the X-axis we go!
- Size of the circle generally higher more to the left
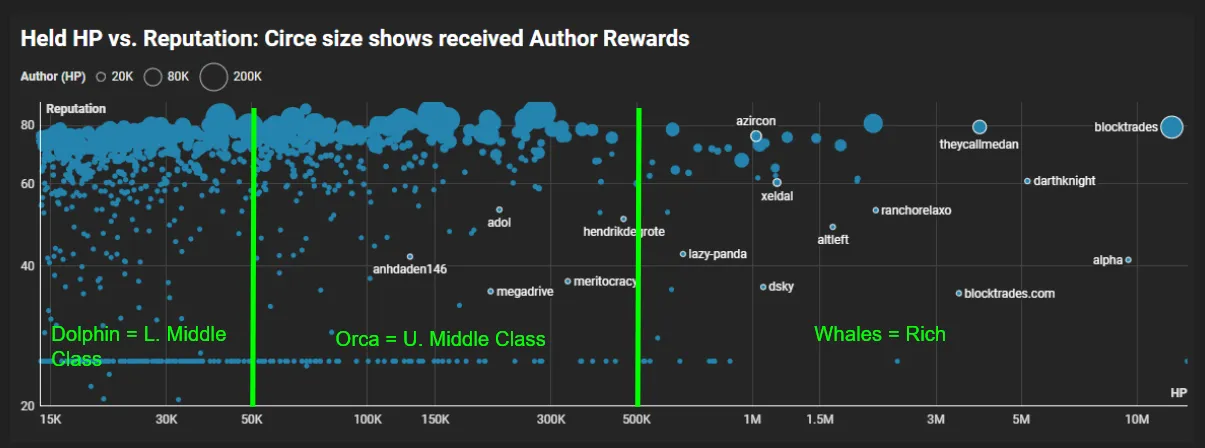
Same plot with our social classes! The lowest HP is 14,126. If your HP is lower than that, your data is not included.
A closer look at our Middle Class
I said in the previous post that a strong and active middle class is very important in the success of any economy, so same goes for our hive economy.
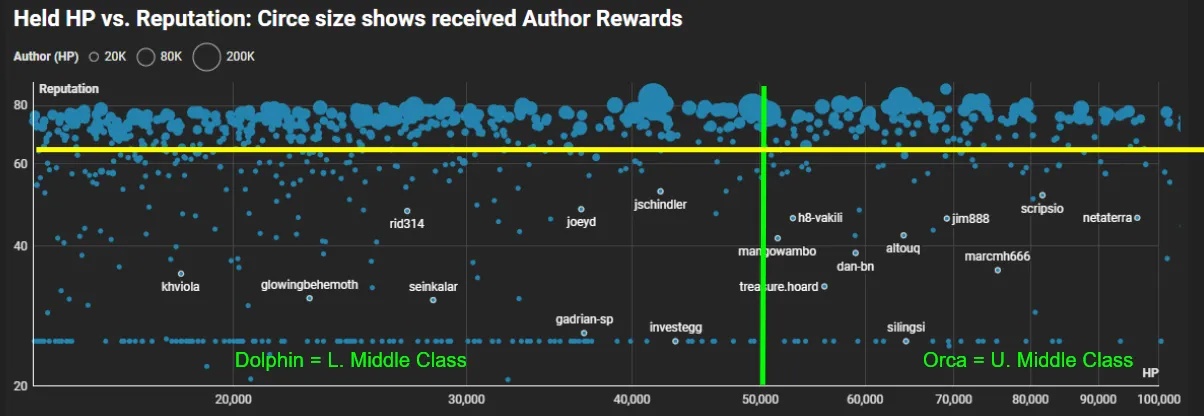
A closer look at HP 100K and below will help us focus on our middle class. You are looking at 800 total accounts in this view. Obviously we need to draw the 65 rep line, which is in yellow.
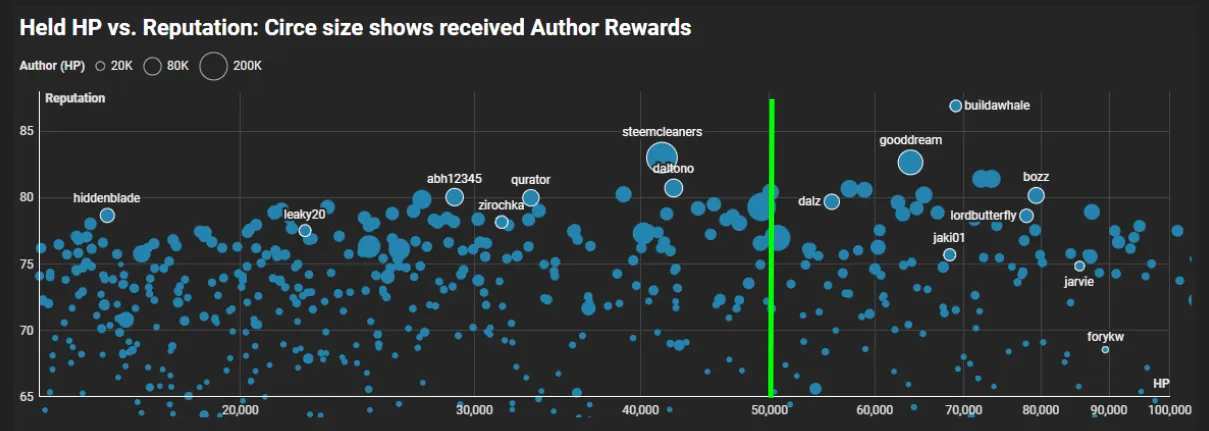
Next we look at the same region of HP, but only in rep 65 and higher, because that is where the action is! I have drawn the 50K HP green line, but I honestly do not see a significant different on either side of the vertical green line. We need to look at Authors HP against Held HP to understand the posting pattern of these folks!
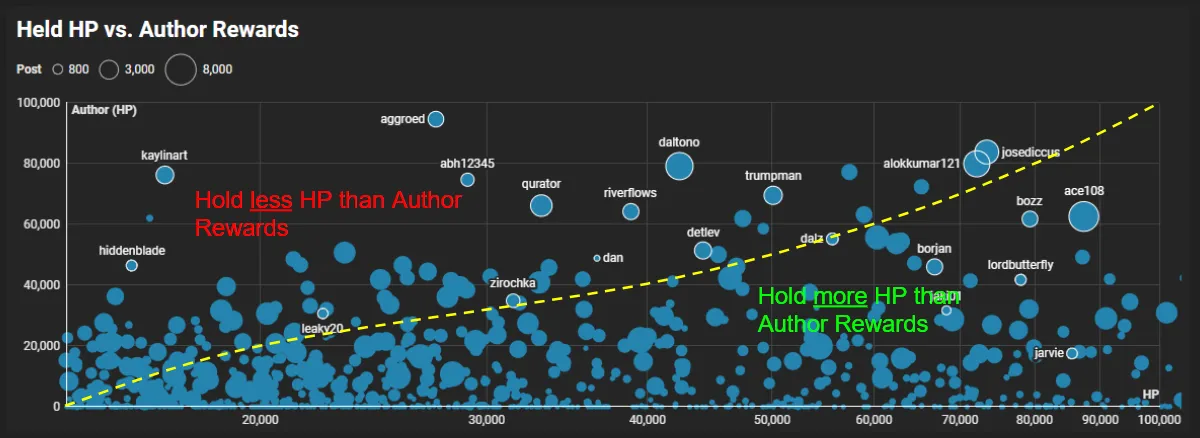
As we have established in the previous post, the dashed yellow like is the Author HP + Held HP isoline. If an account is above this line it is currently holding less HP than the Author rewards.
We did upto here on the previous analysis. The post was well liked and had many comments and requests. One good one was a reminder that Authors also personally curate, either by manual curation or by automation. Both processes earn them Curation rewards. So if we are splitting hairs, we should be looking at Total earning which is Author Rewards + Curation Rewards.
Naughty?
Mind you, this is tongue-in-cheek! Just because you sold some hive doesn't really make you naughty. You might have a good reason to take profit. You might be investing into other on-chain or off-chain assets. It is none of my business. I am just looking at the data.
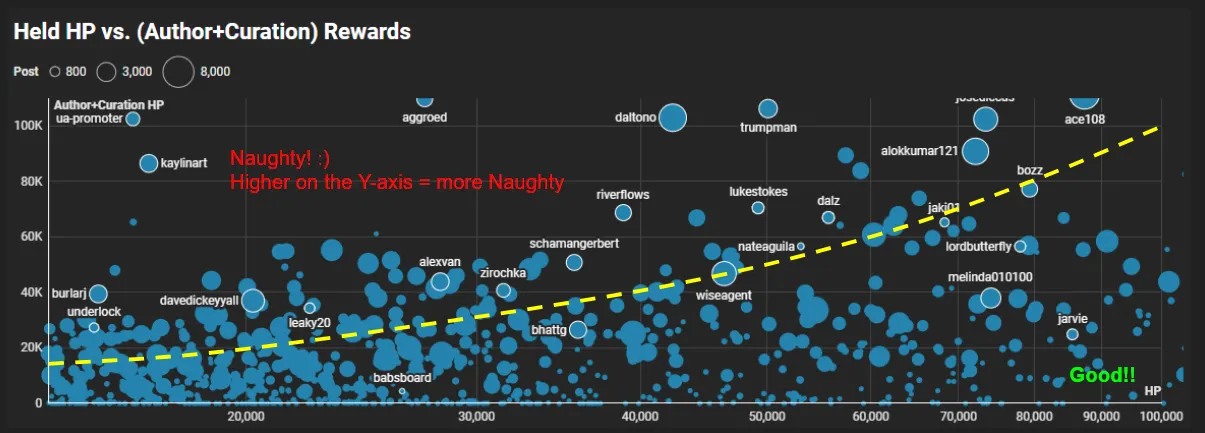
Above the yellow line, you have earned more than you currently hold. Good or Bad is obviously subjective, and I am not judging.
I see this as a positive item. I see more dots below the yellow dashed line than above. This means as a community we are more disciplined. At least our Top 1000 is more disciplined for sure.
Being a scientist, I wanted more concrete estimate. Summarize all the data into a simple number. Can I do that?
I will call it the Krampus Co-efficient! Because why not?
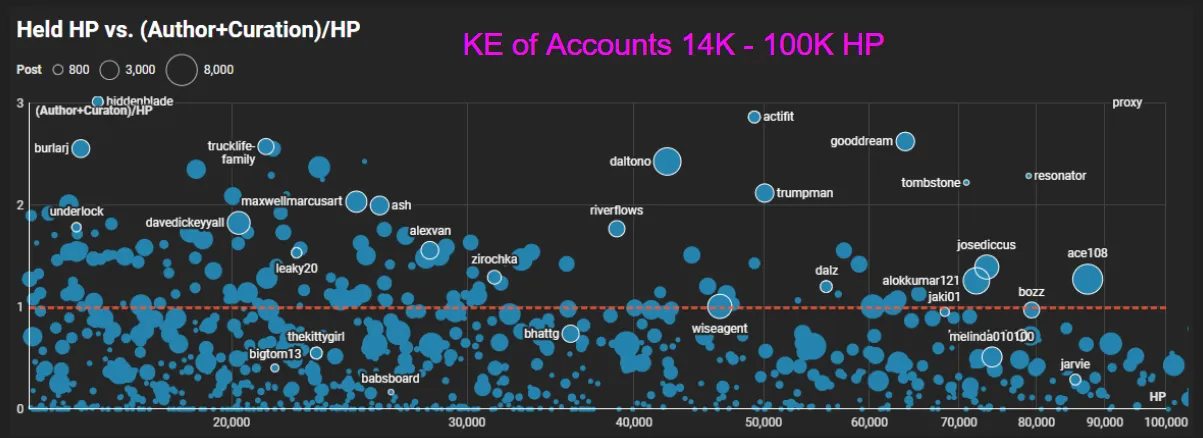
If I divide Author Rewards + Curation Rewards by Held HP, people who held more HP than they earn will have a fraction less than 1.0. Those who held less HP will have a fraction higher than 1.0. This is the Krampus Co-efficient! Or KE.
- KE = 1.0, you hold exactly as you earn (approximately!)
- KE > 1.0, you hold less than you earn
- KE < 1.0, you hold more than you earn
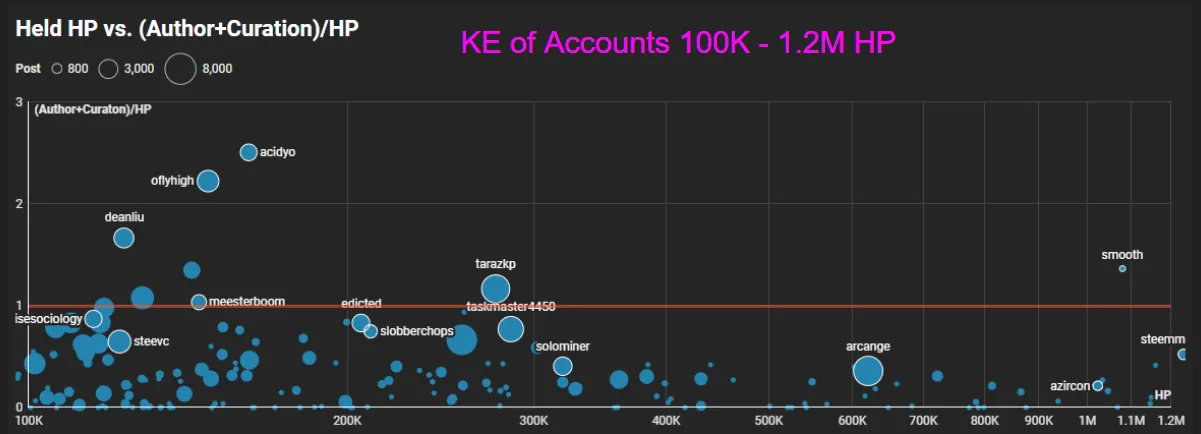
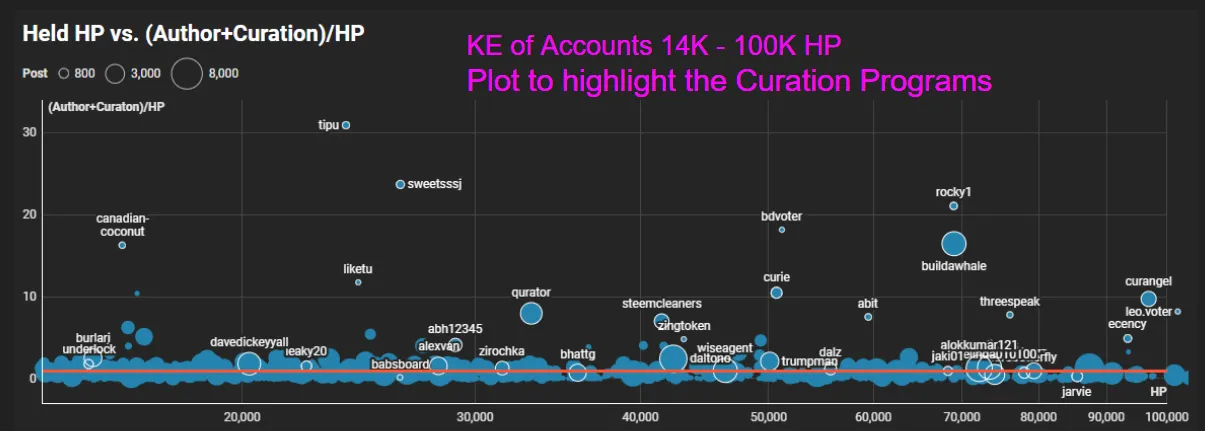
There are three plots above. The first two focus on the Authors, and the third one shows the separation of major curation programs, which are mostly delegated HP. Hive users delegate HP to have curation done by groups of people (curators). The programs generally provides a return to the investors immediately. This is a commercial service, and should not be confused with an individual.
Also another note, the highlighted names are random mostly, unless someone is asking me to put their name or if some name I wanted to see because I intuitively know their hive etiquette.
There you have it. I have detached your shadow from yourself :) It is upto you how you deal with it.
156 accounts out of 1000 have KE > 1.0
6 of those accounts are in Top 200 HP holders
150 accounts out of 800 have KE > 1.0 in the HP holders below Top 200
Curation accounts are excluded.
I feel as a community we are doing well.
Only 15% of our Top 1000 HP holders are net sellers. Rest are holding for an extended period.