Finally the verge block reward halving is completed before halving the block reward was 400 coins per block after approximately every 30 seconds and that is decreased to 200 coins per block. Now the supply of the coins will be slow and eventually, the demand can be decreased and price can rise.
Breakout from wedge and rejection by SMA:
On the long-term weekly chart for the priceline was moving in a falling wedge pattern. And after a powerful bullish divergence, the price action broke out the resistance and also broke out the simple moving averages with the time period of 25 and 50 as well. But at this time it is likely to be rejected by the 100 simple moving average resistance.

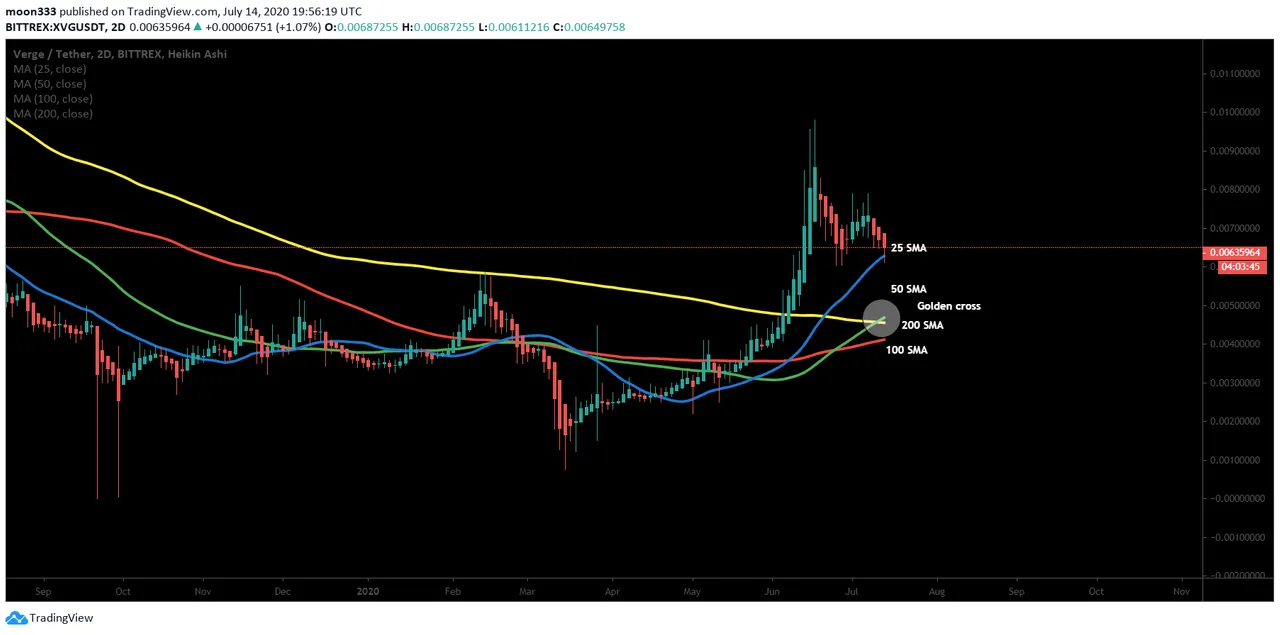
A golden cross formation:
Now if you switch on the 2-day chart the priceline has broken out the 25, 50, 100, and 200 simple moving averages and after a correction rally, the pricline is re-testing the 25 simple moving average as support. If we take a closer look at the chart then 50 simple moving average has formed a golden cross with 200 simple moving average that is considered as a strong buying signal among the trader’s community.
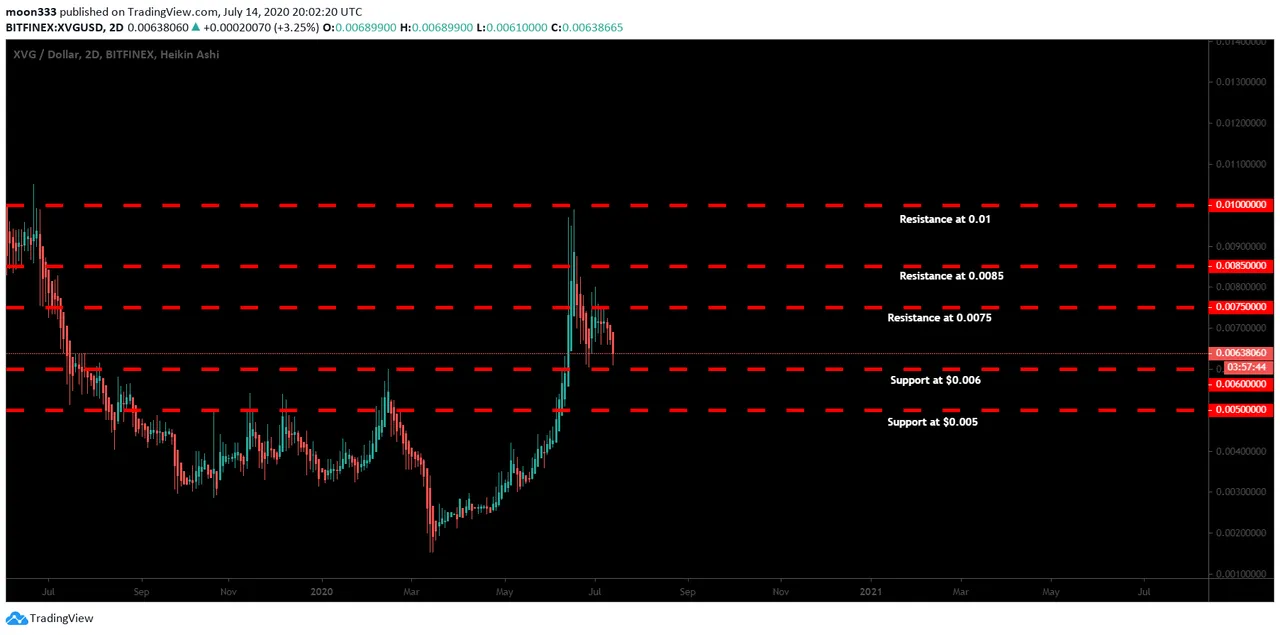
The priceline is retesting previous support:
The different support and resistance levels can also be seen on the 2-day chart. After being rejected by the $0.0075 the price action is re-testing the previous support at $0.006. If this support will be broken down then the next support will be at half-cent. However, if the priceline will move up from here after a successful retest of the support then after $0.0075 the XVG has next resistance at $0.0085, and the key level resistance is at 1 cent.
The price action is rejected by the bearish cloud:
On the long term weekly chart if we watch the Ichimoku cloud then price action is rejected by the upper edge or resistance of the bearish cloud and moved back at the conversion line. However, the cloud is still bullish therefore we can expect another attempt by the priceline to breakout this cloud.

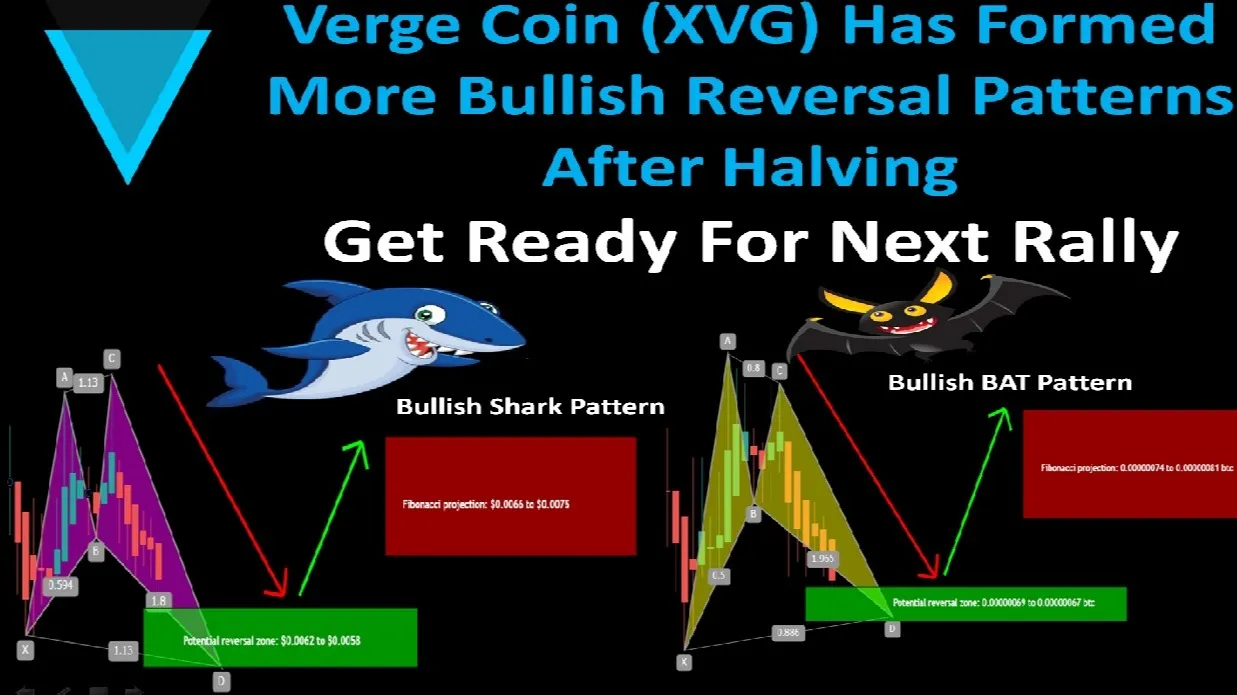
Now I would like to draw your attention towards the different harmonic moves formed by the price action of Verge currency. It has formed the Shark pattern with the US dollar pair and the BAT pattern with the Bitcoin pair. These parents are as below:
XVG with US Dollar pair:
In US Dollar market on daily chart the price action of XVG has completed the bullish Shark pattern an entered in the potential reversal zone. As per Fibonacci sequence of bullish Shark the buying and sell targets can be as below:
Potential reversal or buying zone: $0.0062 to $0.0058
Fibonacci projection: $0.0066 to $0.0075

XVG with Bitcoin pair:
In Bitcoin market on daily chart the price action of XVG has completed the bullish BAT pattern an entered in the potential reversal zone. As per Fibonacci sequence of bullish BAT the buying and sell targets can be as below:
Potential reversal or buying zone: 0.00000069 to 0.00000067 btc
Fibonacci projection or sell zone: 0.00000074 to 0.00000081 btc

Click here to create free account on tradingview to watch and play the chart on realtime
Conclusion:
Even though on the long-term the price action is being rejected by the resistance and moving down. However, on the daily chart the formation of different bullish harmonic patterns is a positive sign that the price action can move back to make another attempt to breakout the resistance levels on the long-term. However, the potential reversal zones of each pattern should be used as a stop loss.
Note: This idea is education purpose only and not intended to be investment advice, please seek a duly licensed professional and do you own research before any investment.