}
In this video you will watch how:
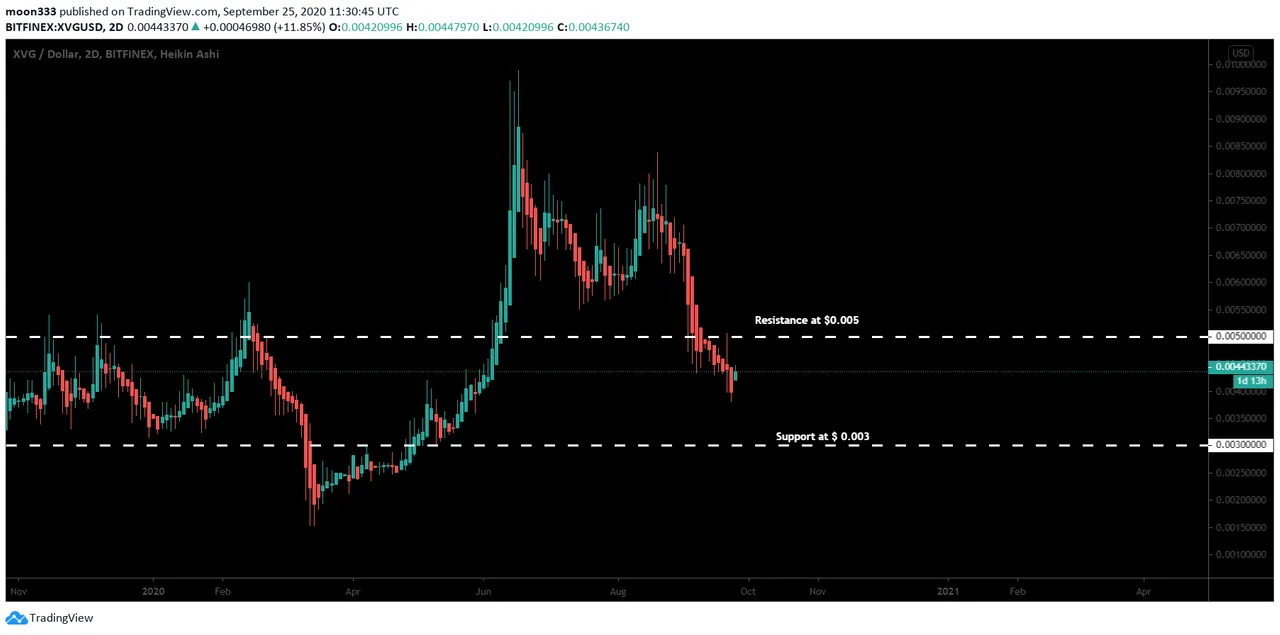
The priceline of Verge coin has broken down the $0.005 support and moving between $0.005 to $0.003.
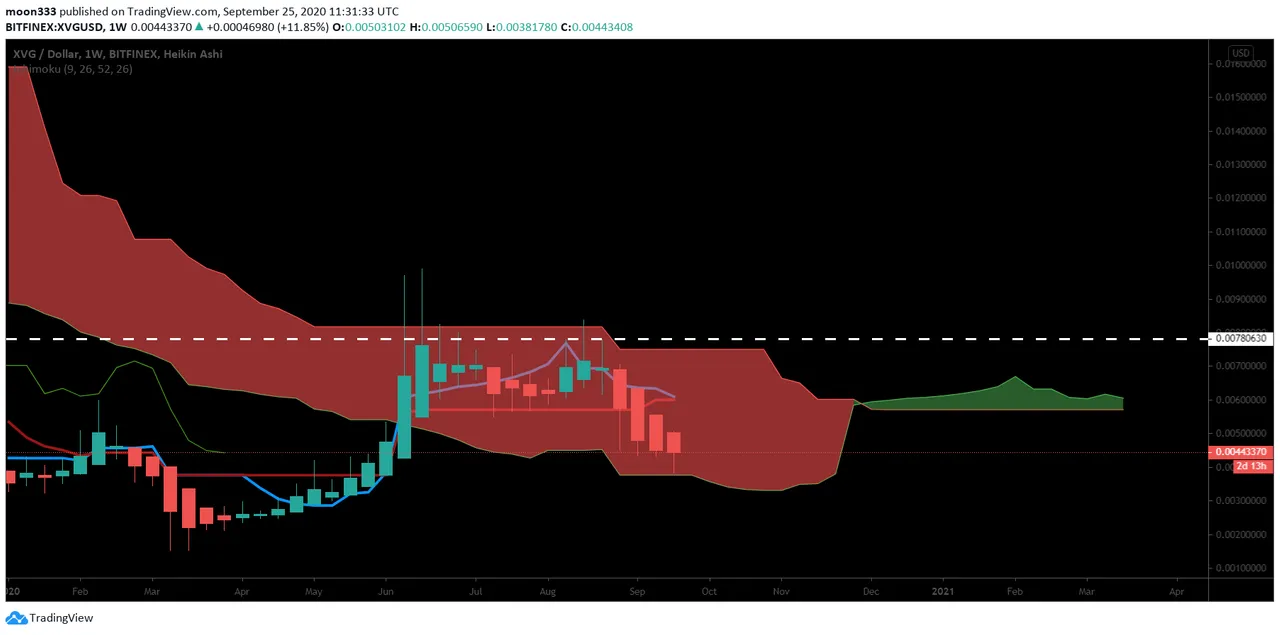
On the weekly chart, the priceline has broken down the 100 and 25 simple moving averages and now likely to break down 50 SMA as well.

The price action of XVG coin is completing the final leg of bullish BAT pattern on the long-term weekly chart.
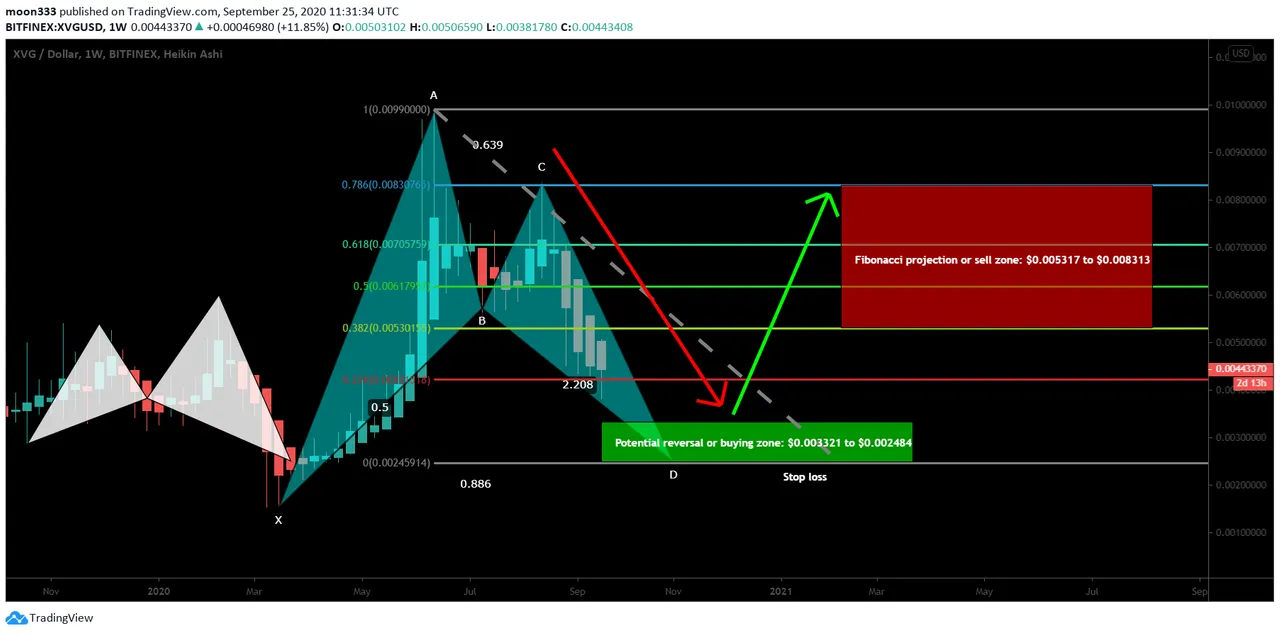
Potential reversal or buying zone: $0.003321 to $0.002484 (this should be used as stop loss as well otherwise the priceline can move down to form Crab )
Fibonacci projection or sell zone: $0.005317 to $0.008313
On weekly chart the priceline has formed a double top at Ichimoku bearish cloud’s upper top. Now the price action of XVG is at the bottom of this cloud and can move more down for the completion of BAT.
Conclusion:
The priceline is likely to take bearish move to the downside. But infact this move can be a bullish reversal, because for the completion of bullish reversal BAT pattern this bearish move is needed.
//////////////////////////////////////////////////////////////////////////////////////////////////////////////////////////////////////////////////////////////
To Join Forsage My Referral Link: https://trx.forsage.io/auth/t/omhpyr/
Make Sure While Signing Up My Forsage ID: 94633 Should Be Displayed On Screen
My Email In case you need help in Forsage setup if you are signing up with my referral: cryptocaptain133@gmail.com