}
Hey friends, hope you are well, and welcome to the new update Ethereum coin.
14000% rally:
From 2015 to 2016 the price action of Ethereum rallied from $0.15 to $21.49 that was more than 14000% gain.

Click here to create a free account on tradingview to watch and play the chart in realtime
22000% rally:
After 14000% gains, the price action of Ethereum started the next rally from 2016 to 2018. This time it was more than 22000%, that was almost doubled move than the previous one.

Click here to create an account on Binance, the best place to buy or sell Ethereum coin
Bullish Cypher move:
it can be also observed that before the second bullish rally the priceline also formed a big harmonic Cypher pattern on the monthly chart and started this big move from the potential reversal zone of this bullish pattern.

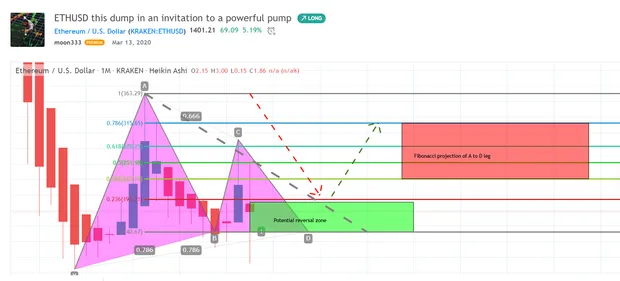
Bullish Gartley move:
Now recently back in March 2020, the price action completed another bullish harmonic Gartley move on the monthly time period chart. I also shared this move in march as below:
Previous bullish Gartley idea before the move:
Previous bullish Gartley idea after 1500% rally:
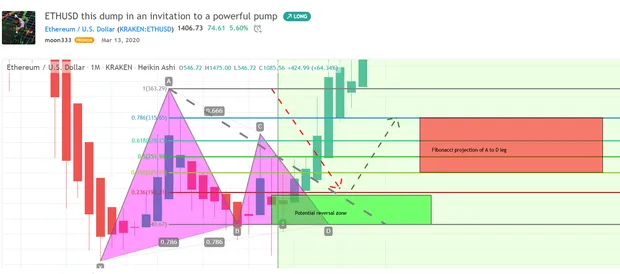
Click here to visit this old article
Now from the potential reversal zone of this pattern the price action has rallied more than 1500% sofar and reached the highest resistance level in its history.
For exact buy and sell targets for this trade, and other harmonic trading signals you can join:
https://www.patreon.com/moon333
Conclusion:
As the priceline of Ethereum has been reached the highest resistance level in its history. This big harmonic Gartley move is a powerful signal that the priceline of Ethereum is again going to make a big move like 2016 to 2018, and it can be doubled than the previous rally.