There are three different ways to show the motion of a chart :
- Line chart
- Bar chart
- Candlestick chart
Since candlesticks show a better and more complete state of the chart, they're more effective in explaining market psychology.
Bar charts are similar to candlesticks, except that the candlesticks have a better graphical and analytical state for display.
Line chart
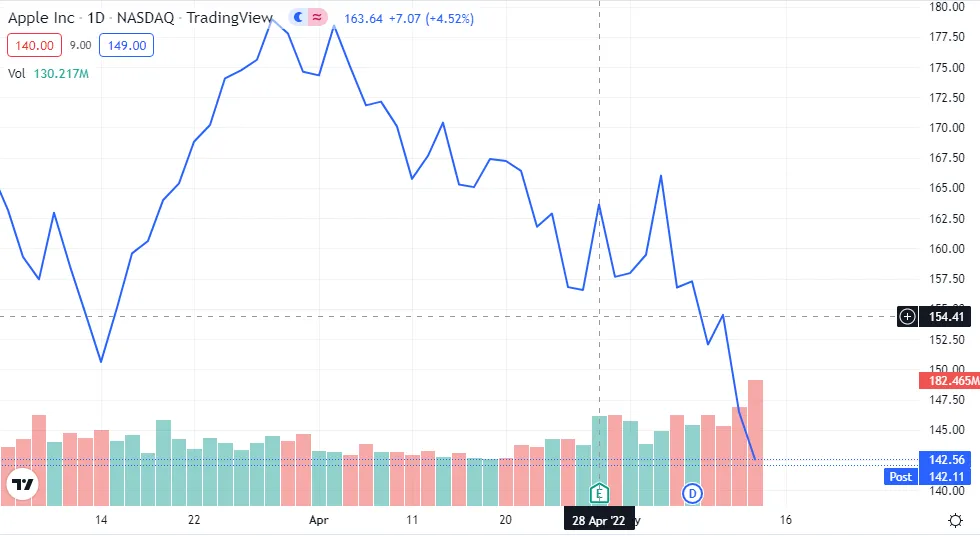
This chart deals only with the last price and the chart doesn't provide any information about the highest price, the lowest and the starting price of the trades. Therefore, the bar chart can not be used for use in trading psychology.
Bar chart
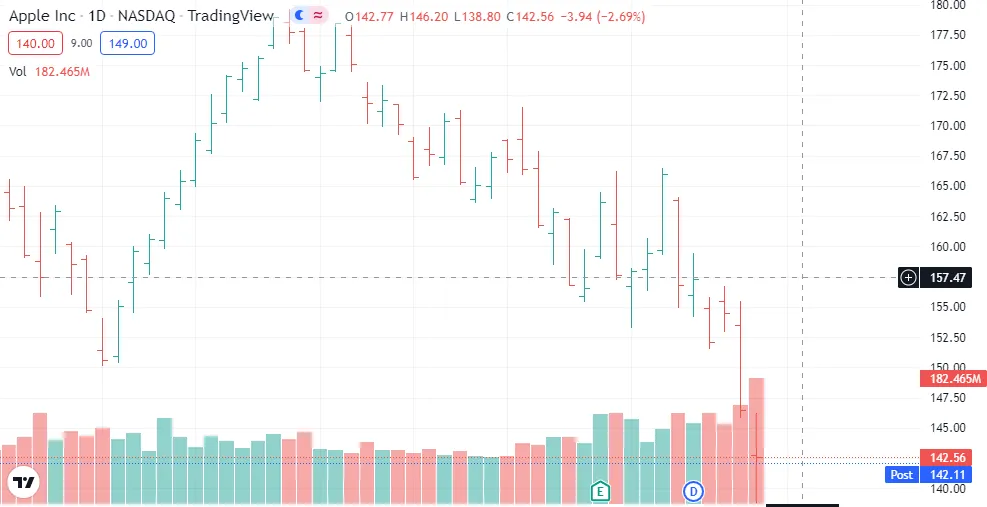
This chart provides information about the first, last, highest and lowest price, and in fact is very similar to the candlestick chart, but due to the graphic status, their use isn't much.
Candlestick chart
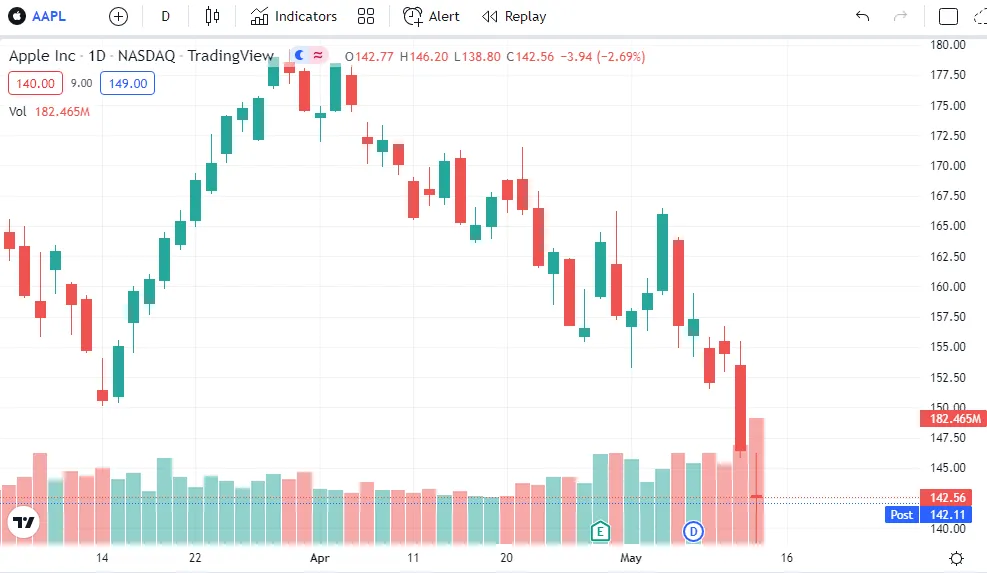
Candlestick chart that can show a better position of the chart both psychologically and graphically