Selam arkadaşlar;
Burada yer alan yatırım bilgi, yorum ve değerlendirmeler Yatırım Danışmanlığı Kapsamında DEĞİLDİR. Yapmış olduğum analiz ve değerlendirmeler teknik verilere dayalı eğitim çalışmasıdır.
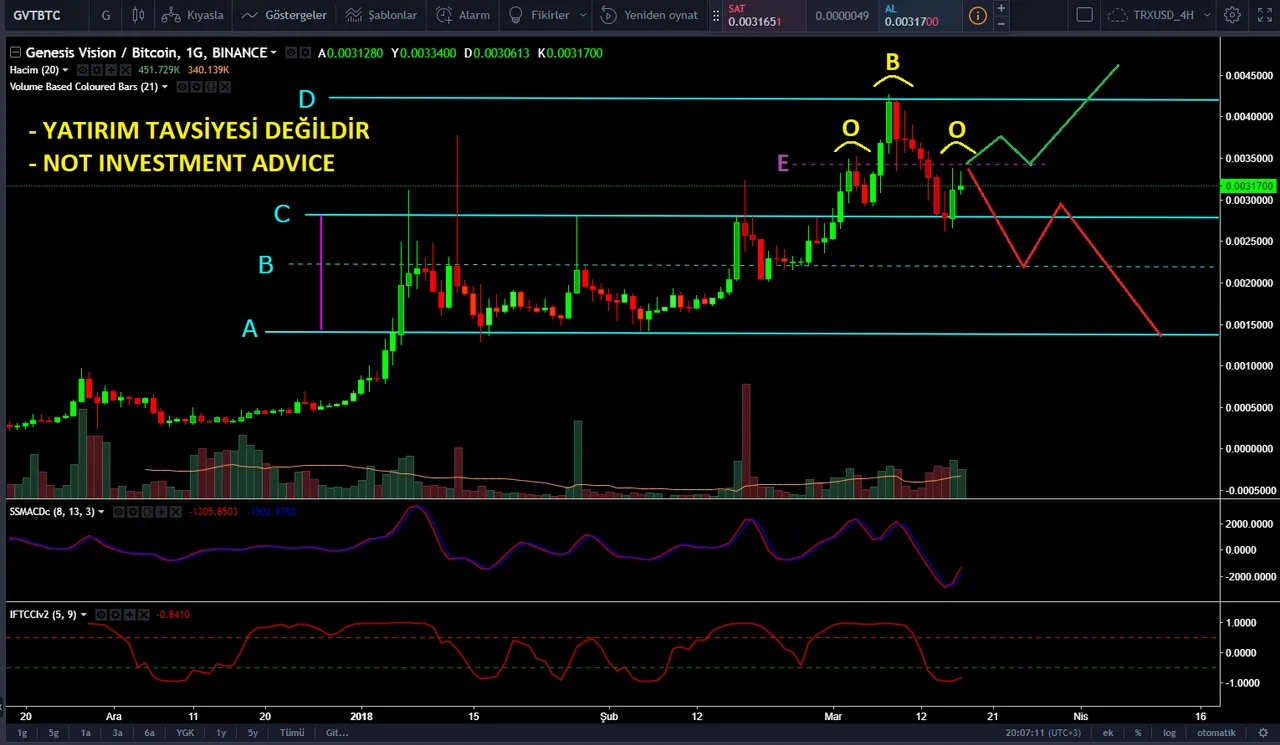
Günlük grafiktir / Daily Chart
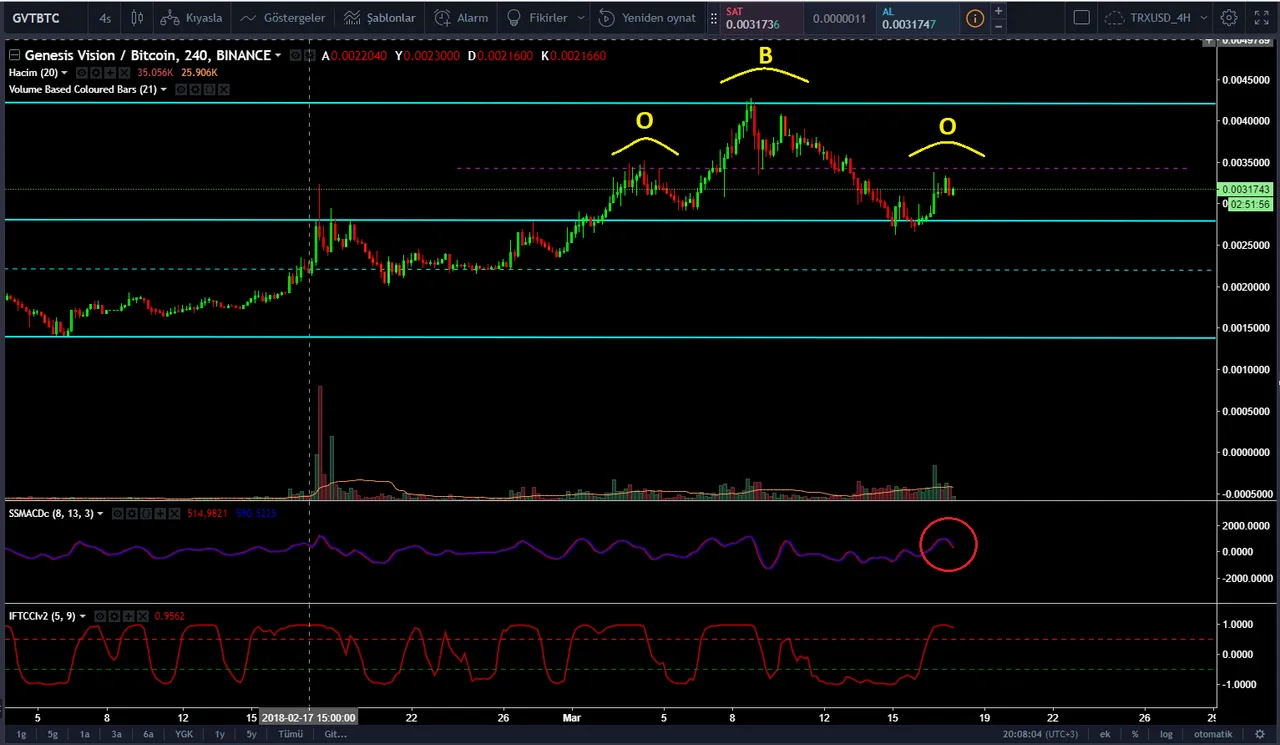
4 Saatlik Grafiktir / 4 Hours Chart
- GVT için daha önceden belirtmiş olduğum D trend çizgisinden dönüş olduğunu görmekteyiz.
- Düzeltme neticesinde ise C trend çizgisinden tepki geldiğini görüyoruz.
- Hali hazırda ise grafikte bir OBO görüntüsü oluşmuş durumda. E trend çizgisi geçilememesi durumunda yönün aşağı olacağını beklemekteyim.
- E trendi geçilirse yönün tekrar yukarı olacağını söyleyebilirim.
- SSMACD günlük grafikte yönü yukarı gösterirken, 4 saatlik grafikte yönü aşağı çevirmiş durumda.
Teknik analiz ile ilgili sorularınızı ve eleştirilerinizi yorum olarak yazmanız beni mutlu edecektir.
English
Hello Friends;
The investment information, comments and evaluations contained herein are NOT IN Investment Advisory. The analyzes and evaluations I have made are based on technical data.
- We see that the return from the D trend line I mentioned earlier for GVT.
- In the case of correction, we see that the price is turning back from the C trend line.
- There is a SHS formation on the chart. If the price can not pass the E trend line, I expect to be down.
- I can say that if the E trend is passed, the direction will be up again.
- While SSMACD is pointing up in the daily chart, it has turned downwards in the 4-hour chart.
I would be happy if you write down your comments about technical analysis.
Önceki GENESIS VISION (GVT) Teknik Analizlerim / My Previous GENESIS VISION (GVT) Technical Analysis
1-GENESIS VISION (GVT) Teknik Analizi / GENESIS VISION (GVT) Technical Analysis [01.03.2018]