The weekly chart of Gold from ~2000 shows the rise, fall and consolidation.
There is a Fibonacci retracement from the lows to the peak in 2011. (Blue lines) The purple line is the 50% retracement area which it found support on in late 2015.
It has been in a consolidation range for 2.5 years and it has broken the lower trend line support.

The daily chart shows the break below the lower trend line and that it is under the 200 dma.
If it continues to drop, it may find support at the last major low of 1122 that was produced in December 2016.

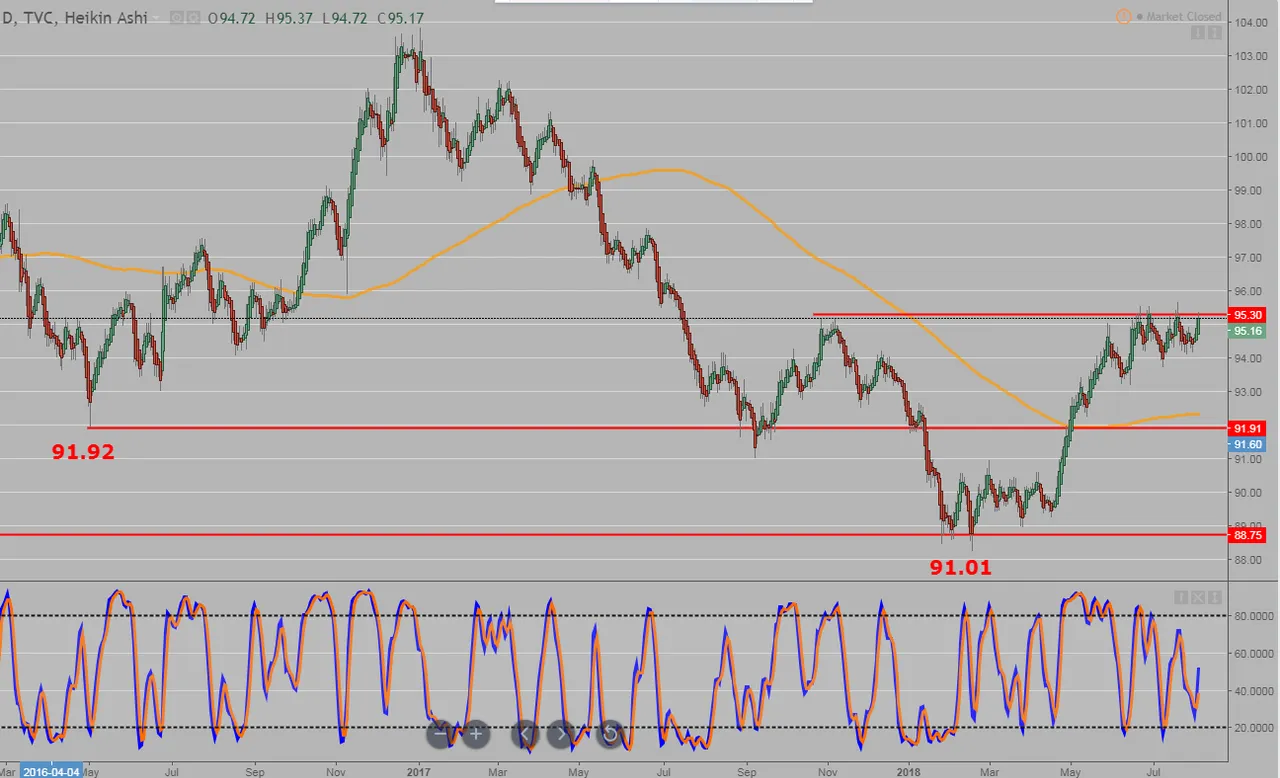
The US Dollar Index (DXY ETF) has shown strength over the last few weeks which has been causing the sell off in precious metals and other commodities.
It is close to breaking above the upper resistance level of 95. If it does, the precious metals markets along with certain commodities may continue the downwards trend.
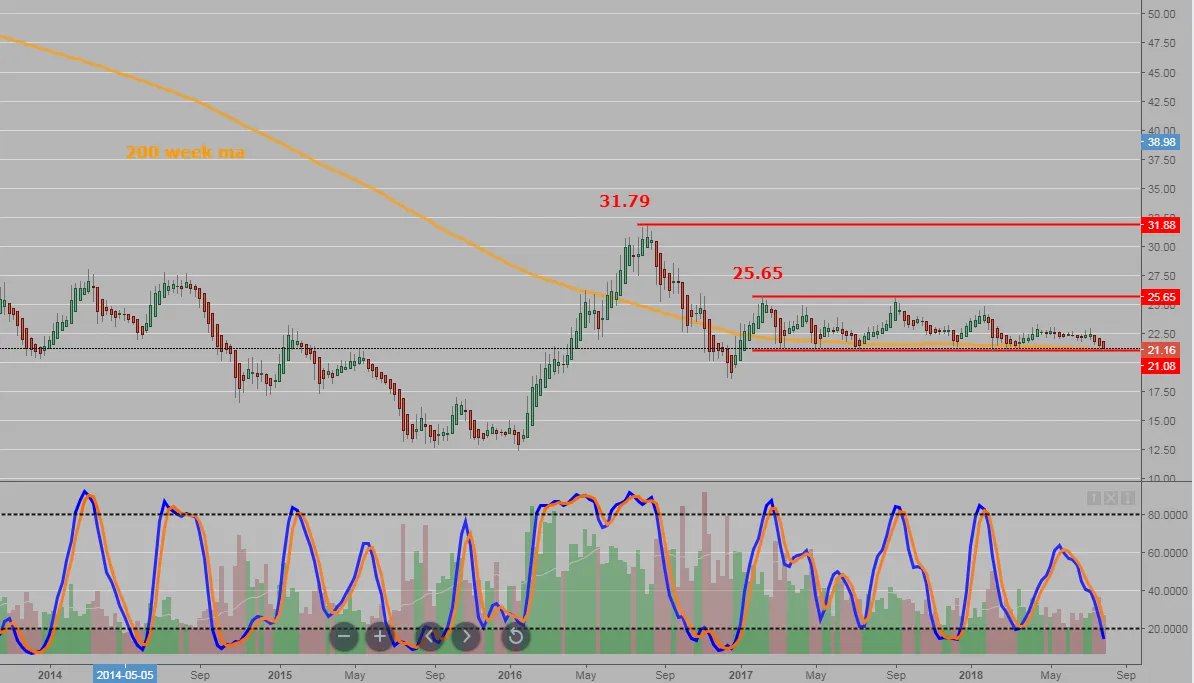
Silver is unable to break above the 200 week moving average.

The Gold/Silver miners is at the lower support line and the 200 week moving average.
For those interested in these markets, keep your eye on the US Dollar Index as that will be setting the sentiment for the commodities sector.