
SUMMARY
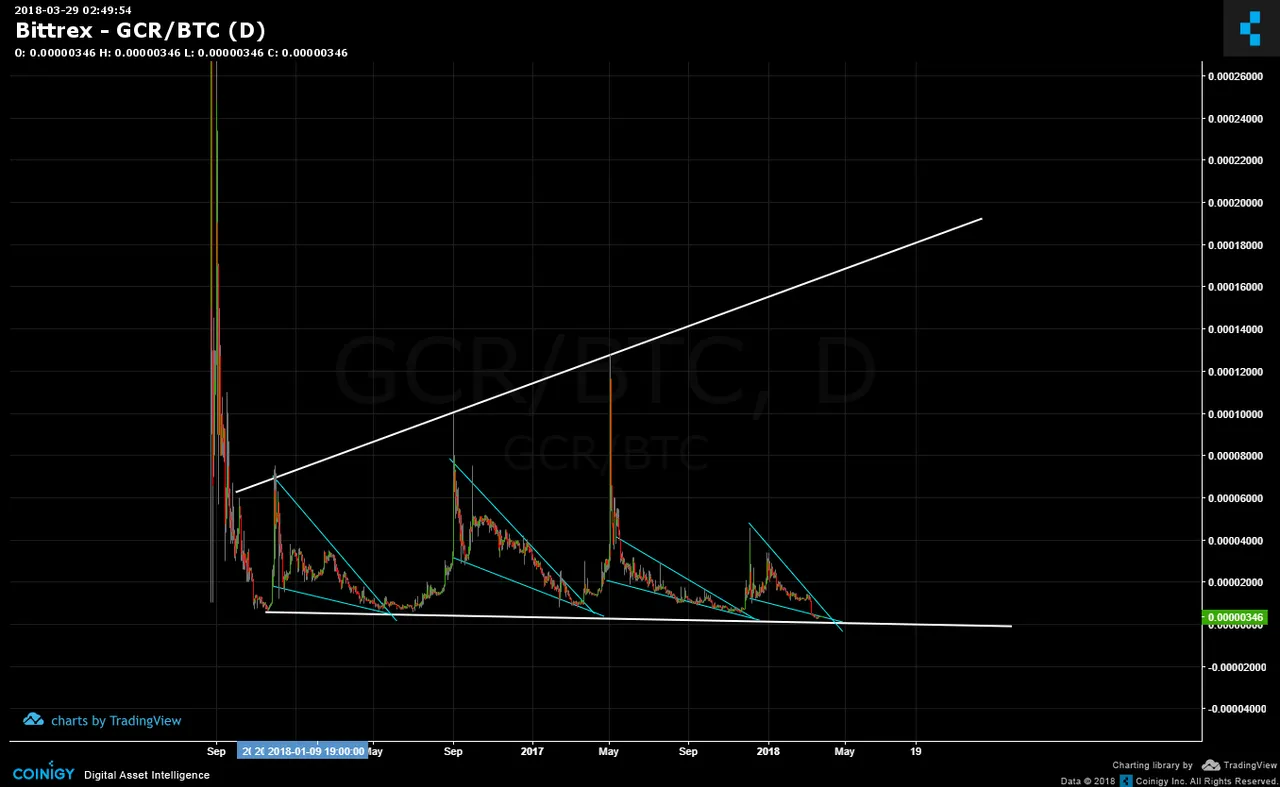
The below chart of Global Currency Reserve (GCR/BTC) is quite unique in the sequence of fractals. Even in these, the hurry up, vertical nature of the price rises are followed by the longer and wider corrections. A precision execution of the Hurry Up & Wait Syndrome.
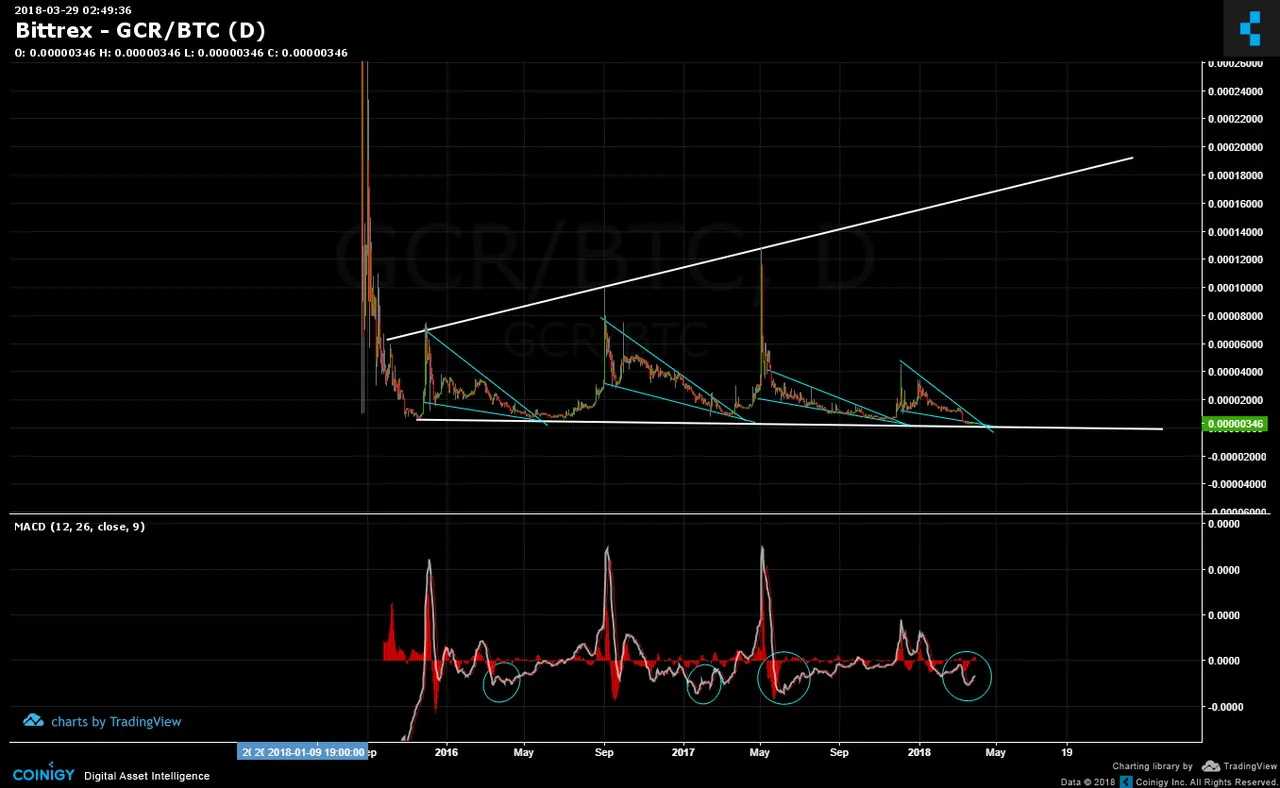
When viewing the MACD, there was a point of consolidation (blue circles) before the near vertical rise in price and MACD. There is a cycle being played out in both price and MACD and the frequency of this cycle is naturally very fractal. Given the current price sitting on the bottom trend line support and MACD consolidating...in which direction is most likely for the next price movement?
Legal Disclaimer: I am not a financial advisor nor is any content in this article presented as financial advice. The information provided in this blog post and any other posts that I make and any accompanying material is for informational purposes only. It should not be considered financial or investment advice of any kind. One should consult with a financial or investment professional to determine what may be best for your individual needs. Plain English: This is only my opinion, make of it what you wish. What does this mean? It means it's not advice nor recommendation to either buy or sell anything! It's only meant for use as informative or entertainment purposes.
Please consider reviewing these Tutorials on:
Elliott Wave Counting Tutorial #1
Elliott Wave Counting Tutorial #2
Elliott Wave Counting Tutorial #3
Laddering and Buy/Sell Setups.
Laddering Example with EOS
Tutorial on the use of Fibonacci & Elliott Waves
@haejin's Trading Nuggets
Essay: Is Technical Analysis a Quantum Event?
Follow me on Twitter for Real Time Alerts!!
Follow me on StockTwits for UpDates!!
--
--

