AUDUSD technical analysis and trade idea
Chart Timeframe: H4
Patterns and Facts:
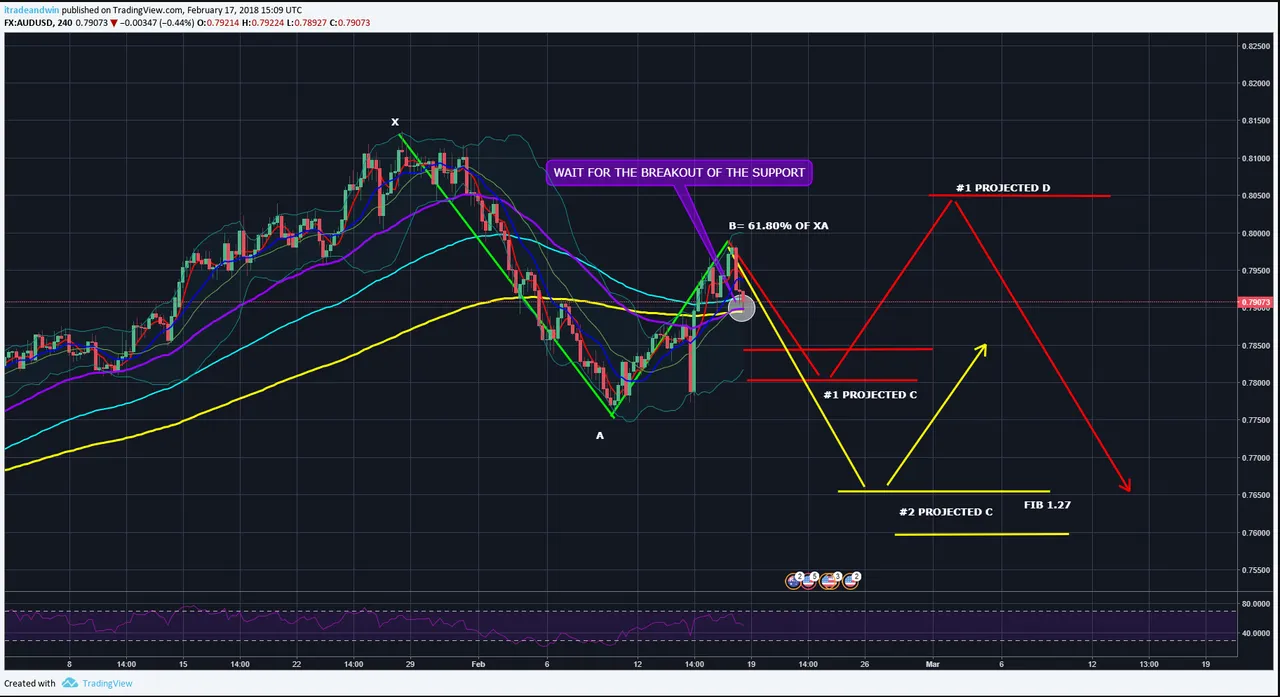
AUDUSD is testing the EMA 50 and EMA 200 Support ( Very close to each other ). Price pulled back from Fibonacci 61.80% of XA move ( 0.79840). RSI headed South.
Predicted Movement:
AUDUSD is likely to break below 0.78880 EMA 50 support and test 0.78400 Fibonacci 61.80% of AB move. Then we will have two scenarios.
1.The next level will be 0.78120. If breaks below 0.78120, we predict the pair will continue its bearish movement to complete C at 0.76600 Fibonacci 1.27 of XA.
http://chartreaderpro.com/audusd-technical-analysis-trade-idea/