
Most of the traders across the globe trade the Forex Market using candlestick charts. The reason for this is the numerous advantages candlestick charts offer to the Technical Traders. Before going right into the topic, let’s understand where it all began. The history of candlestick charts dates back to the 17th Century. A Japanese rice trader ‘Sokyu Honma’ first invented the candlestick chart to understand the patterns of consumer buying behaviour. From then, these candlesticks have evolved with time and resulted in the charts that we used today to trade various financial markets.
One of the many advantages of these candlesticks is the patterns that occur on the price charts. These patterns occur when one or more candlesticks are combined. Technical trading experts have identified many such patterns over the years and backtested them to understand what those patterns essentially mean. The occurrence of these candlestick patterns helps us forecast the market accurately. Learning these Forex chart patterns will give technical traders an edge over the market.
In this article, we will be discussing many such candlestick patterns. These patterns are segregated into different types based on the number of candles that are present in the pattern. For instance, if a Forex chart pattern has two candlesticks, it is known as a dual candlestick pattern. Also, if the occurrence of a pattern continues the existing trend of the market, they are known as continuous patterns. Contrarily, if the appearance of a pattern reverses the underlying trend, we call them as reversal patterns. Primarily let’s discuss Single, Dual, and Triple candlestick patterns and how exactly to trade them.
Single Forex Chart Patterns
As discussed, a single Forex chart pattern is where only one candlestick is involved in the formation of that pattern. Let’s see both continuous and reversal single candlestick patterns with examples.
Marubozu Candlestick Pattern
The meaning of the word Marubozu is Shaved Head or Bald Head in the Japanese language. As the name suggests, in this pattern, the candlestick doesn’t have any wicks or shadows.
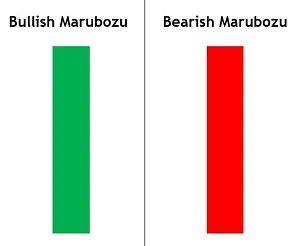
This Forex chart pattern has one single candlestick, which is either bullish or bearish. If this pattern is found in an uptrend, it means that the buyers are still active, and the trend is supposed to continue. Likewise, a Marubozu in a downtrend implies the selling pressure is still prevailing in the market. Traders must continue holding their long positions in the occurrence of a bullish Marubozu Pattern and vice-versa in the appearance of a bearish Marubozu Pattern.
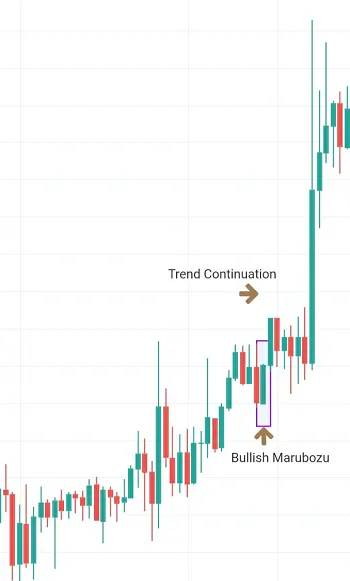
In the above Forex chart, we can see that the market was in an uptrend when the Bullish Marubozu candle appeared, and the price shot up in the north direction, indicating the continuation of the trend.
Shooting Star Candlestick Pattern
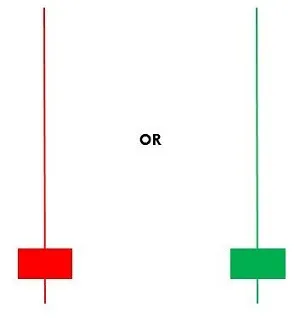
Shooting Star is also a single candlestick pattern, but it indicates the reversal of the existing market trend. The body of a Shooting Star candle is tiny with a long upper wick and short to no lower wick.
Typically, this pattern appears at the end of an uptrend and indicates that the downtrend is about to start. Necessarily, the Shooting Star Forex chart pattern implies that the sellers have stepped in, and buyers began to lose control.
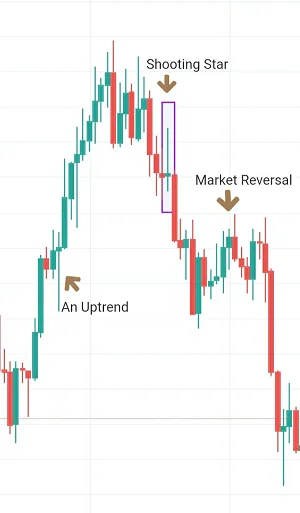
In the above chart, we can see that the overall market was in an uptrend. We can then see the appearance of the Shooting Star pattern and the corresponding market reversal.
Dual Forex Chart Patterns
Two successive candlesticks form a Dual Forex cart pattern. These patterns are extremely effective as they provide the most profitable signals if traded correctly. Let’s discuss some of the most reliable dual candlestick patterns, which indicate both trend continuation and reversals.
Harami Candlestick Pattern
Harami is a double candlestick pattern that indicates the continuation of the trend in any underlying currency pair. This pattern occurs in both uptrend and downtrend; hence we should be learning both bullish and bearish Harami patterns. The bullish Harami pattern can be found in an uptrend, and it is formed by a large bearish candle followed by a small bullish candle. The bullish Candle must be totally contained within the vertical range of a bearish candle. When this pattern occurs, we must continue scaling our long positions as we know that the trend is going to continue further.
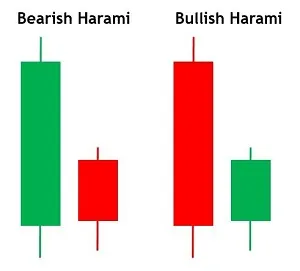
A bearish Harami pattern is formed by a long bullish candle followed by a small bearish candle. The bearish candle must be totally contained within the vertical range of the bullish candle. We must look out for scaling our short positions in the occurrence of a bearish Harami pattern.
Fun Fact: Harami in the Japanese language means ‘pregnant,’ and we can see the reason why this pattern is named this way.
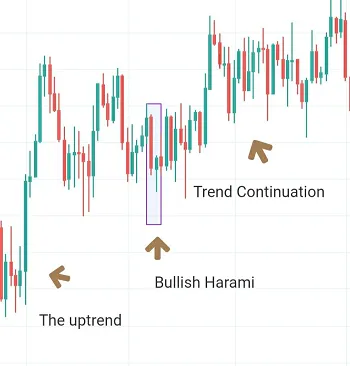
n the above chart, we have identified the bullish Harami pattern in an uptrend, and the trend has continued further.
Dark Cloud Cover Candlestick Pattern
Dark Cloud Cover is a dual candlestick bearish reversal pattern formed in an uptrend. This pattern is formed by a Green candle accompanied by a Red candle that opens above the close of the prior Green candle. The bearish candle is closed below the midpoint of the previous bullish candle.
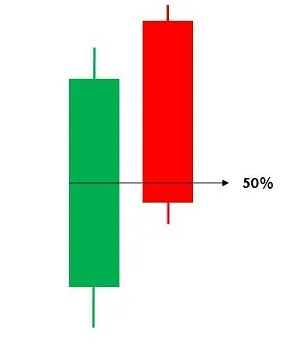
The appearance of this pattern on a price chart implies that the buyers are losing control while they try to push the price further. This means that the sellers are taking over the market, and a downtrend is anticipated. We must look out for selling positions as soon as the pattern confirmation is done.
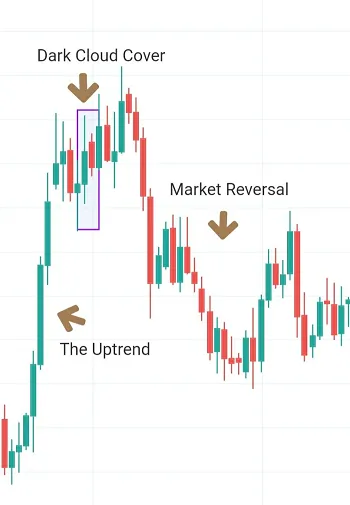
In the above price chart, the market was in an uptrend. Then we can see the occurrence of the Dark Cloud Cover pattern, which eventually reversed the market trend.
Triple Forex Chart Patterns
In a triple candlestick pattern is formed by three successive candlesticks. The appearance of these patterns on the price chart is rare compared to the other two pattern types. At the same time, these patterns are more reliable compared to the other two pattern types.
Three White Soldiers Candlestick Pattern
This is a bullish candlestick pattern consisting of three Green candles. This pattern essentially indicates the continuation of the uptrend in any given currency pair. Three White Soldiers pattern is formed by three bullish candles that are stacked one above the other in an upward direction. Each of the candles opens within the preceding candle’s body and closes after the preceding candle’s high.
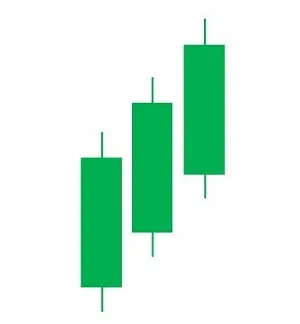
Technical traders use this pattern as potential entry and exit points. Those who were shorting the pair should be exiting their trades and who were trying to take advantage of the long term trend must go long as soon as they identify this pattern.
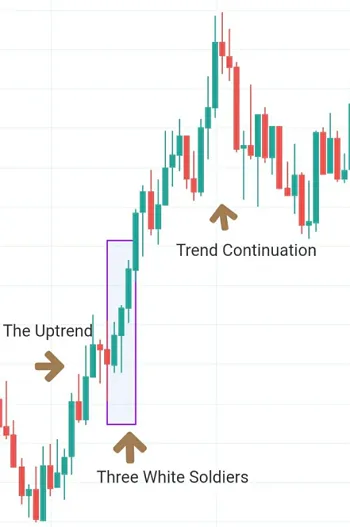
In the above chart, we can see that the market was in an uptrend. After the appearance of this pattern, the market shot up to the north, indicating the continuation of the trend.
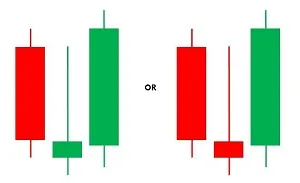
Morning Star Candlestick Pattern
Morning Star is a bullish trend reversal pattern that is typically found in a downtrend. This pattern is made up of three candles - a big bearish candle followed by a small bullish or bearish candle and a big bullish candle. The trend reversal is visually clear when we see the Morning Star pattern on a price chart.
Obviously, we should be willing to lo long right after we identify this pattern in a downtrend. Make sure to wait for a couple of confirmation candles (bullish) before going long on any currency pair.
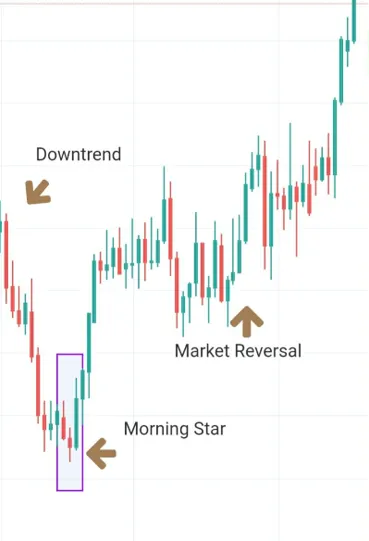
The market was in a downtrend in the above price chart. Once the Morning Star pattern is formed at the end of the downtrend, the price changed its direction as the buyers took over the market.
More Forex Chart Patterns
We have seen some of the most reliable single, dual, and triple candlestick patterns, which indicate both trend continuation and reversal signals. Let’s also cover one candlestick pattern that is made up of four candlesticks.
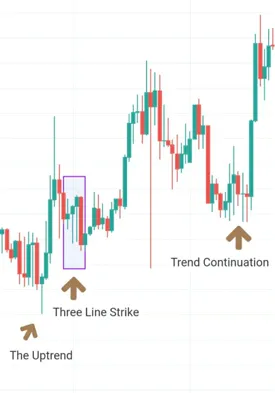
Three Line Strike Candlestick Pattern
This pattern occurs in an uptrend and a downtrend, so there are both bullish and bearish Three Line Strike patterns. A bullish Three Line Strike pattern is made up of three Green candles in a downward direction accompanied by a long Red candle indicating the continuation of the trend. The situation is vice-versa in the case of a bearish Three Line Strike pattern.
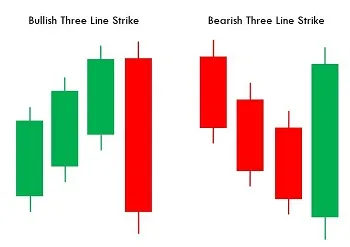
We must be scaling our current positions once we identify this pattern on the Forex charts. In the below image, we can see the appearance of the Bullish Three Line Strike pattern and how the trend has continued after its occurrence.
Bottom Line
That’s about Forex Chart Patterns and how to trade them. It is recommended not to trade these patterns stand-alone. We must combine them with some of the reliable technical indicators like RSI and MACD or other price-action tools to confirm the signals generated by these patterns. Also, make sure to backtest these patterns in a demo account before trading them on the live markets.
We hope you had a good read. Let us know if you have any questions in the comments below.
Hopefully, you have enjoyed today’s article. Thanks for reading!
Have a fantastic day!
Nisha Patel
Live from the Platinum Trading Floo