The strategy is simple: I am selling/buying bounces from trendlines (not all trendlines some are there to determine a position for a take-profit).
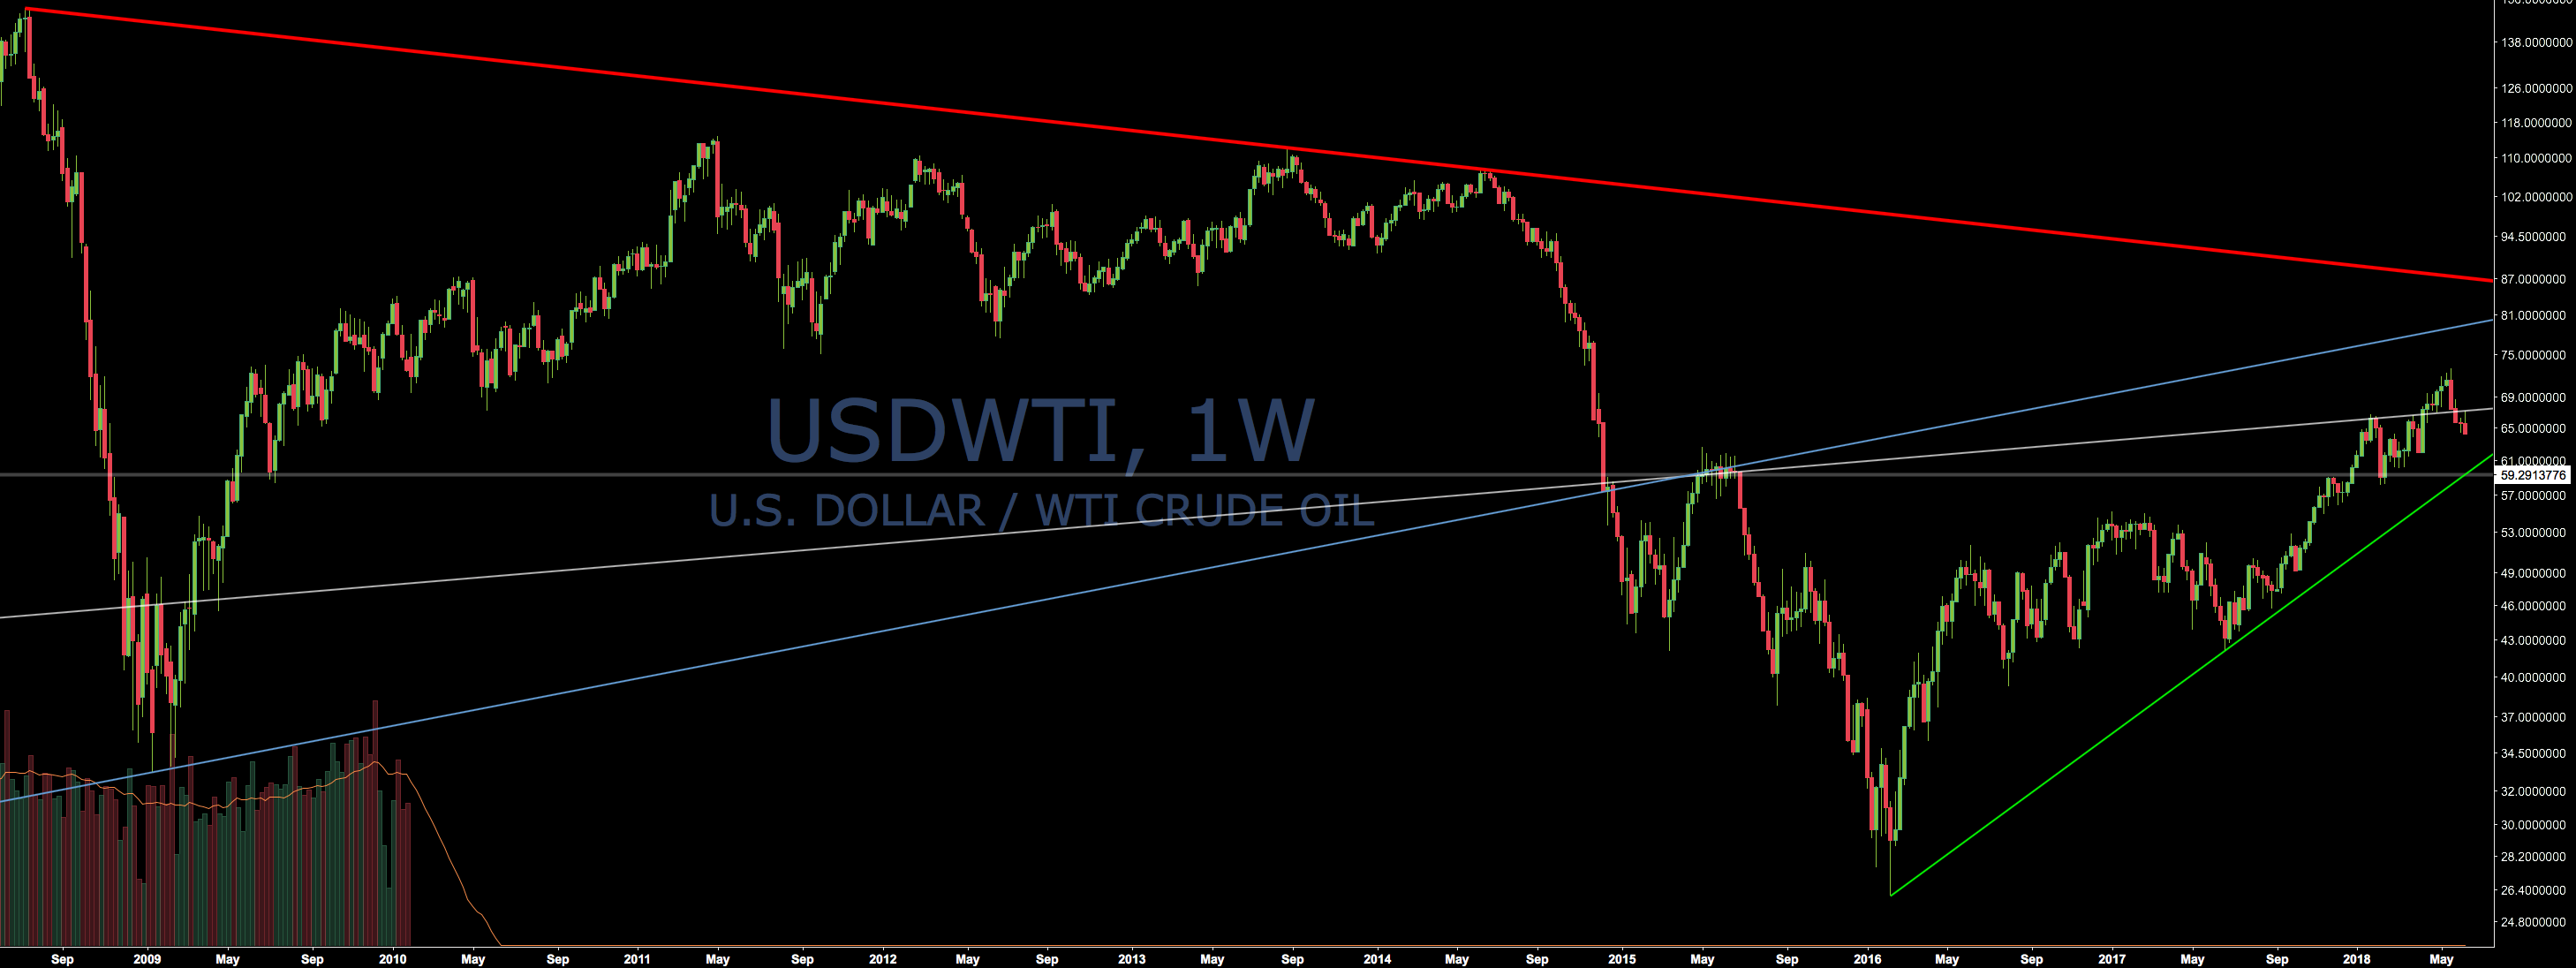
#USDWTI
#EURCAD
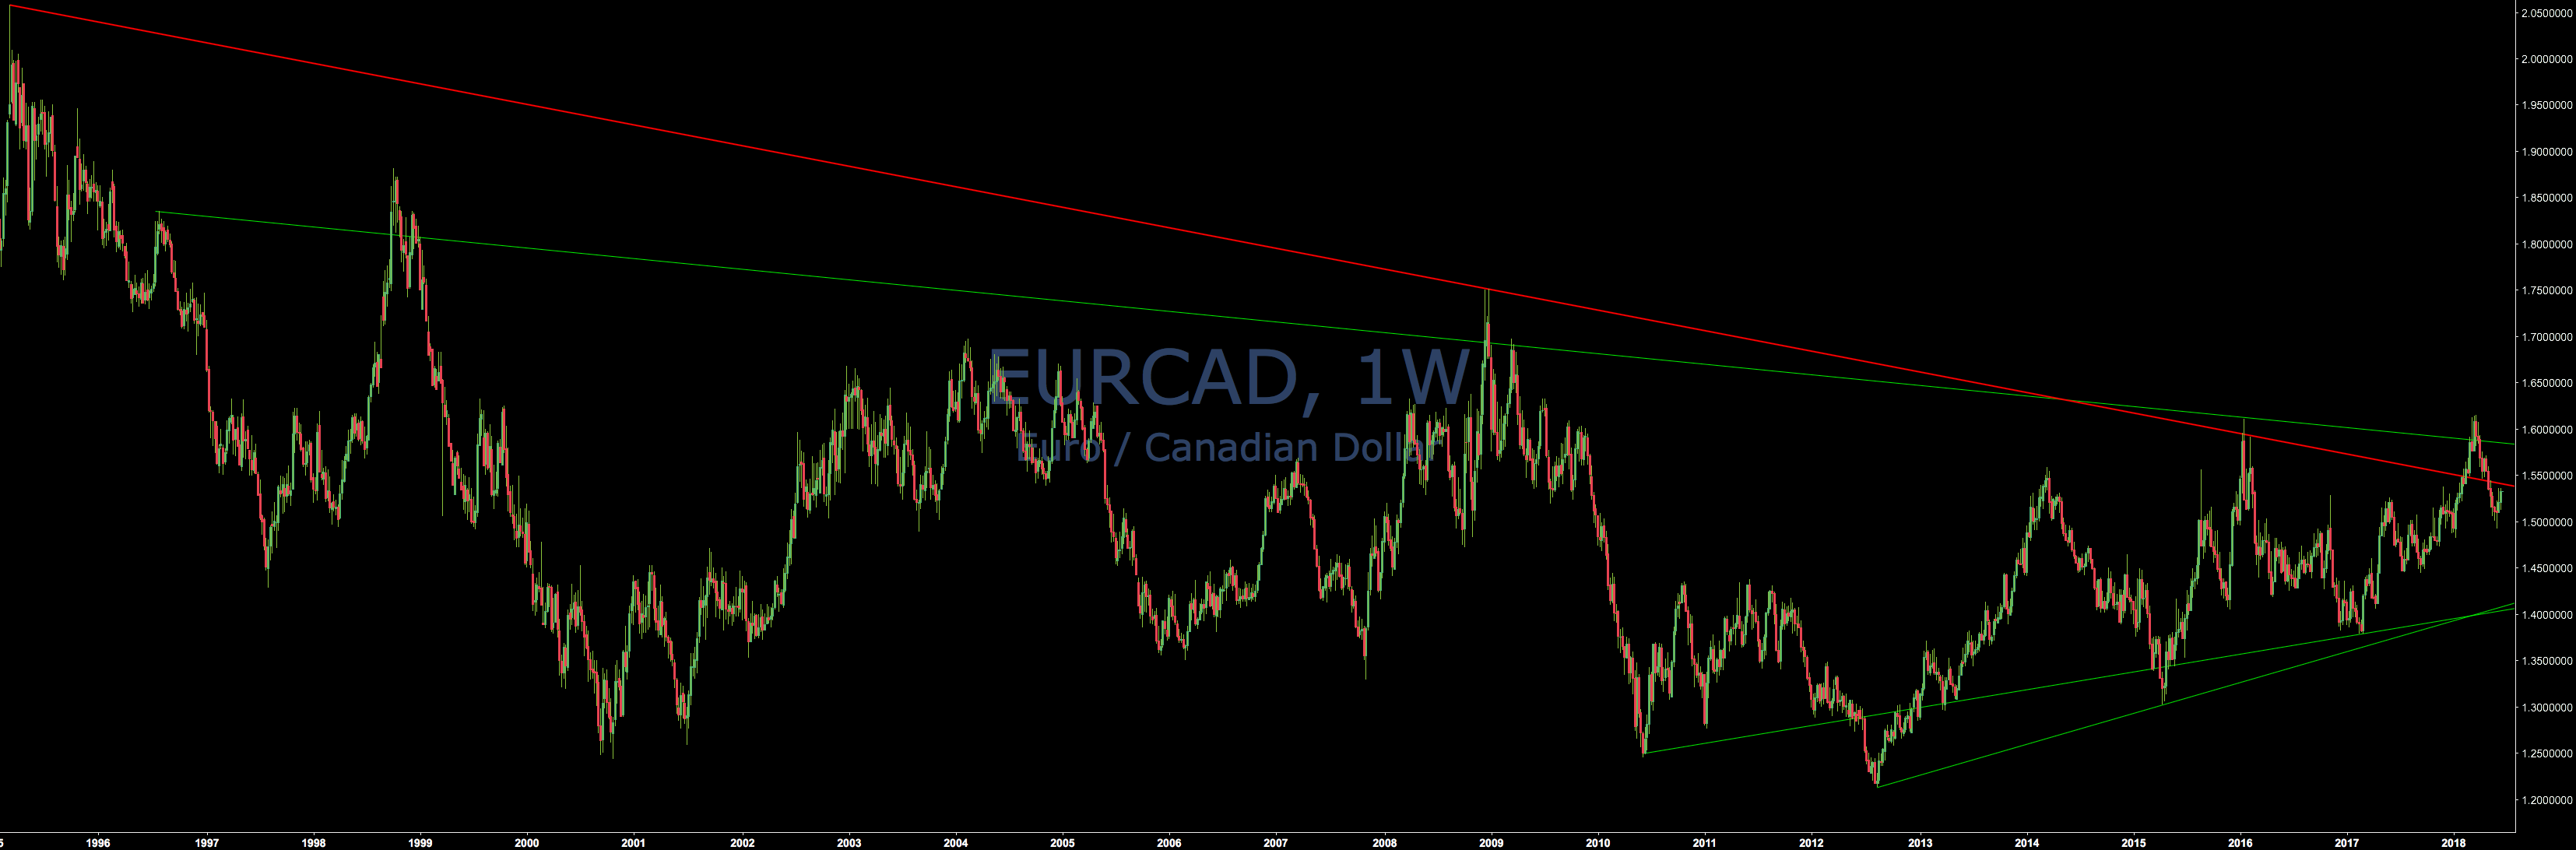
Red trendline looks sellitelně but not nice because of those false breakouts.
#GBPCAD
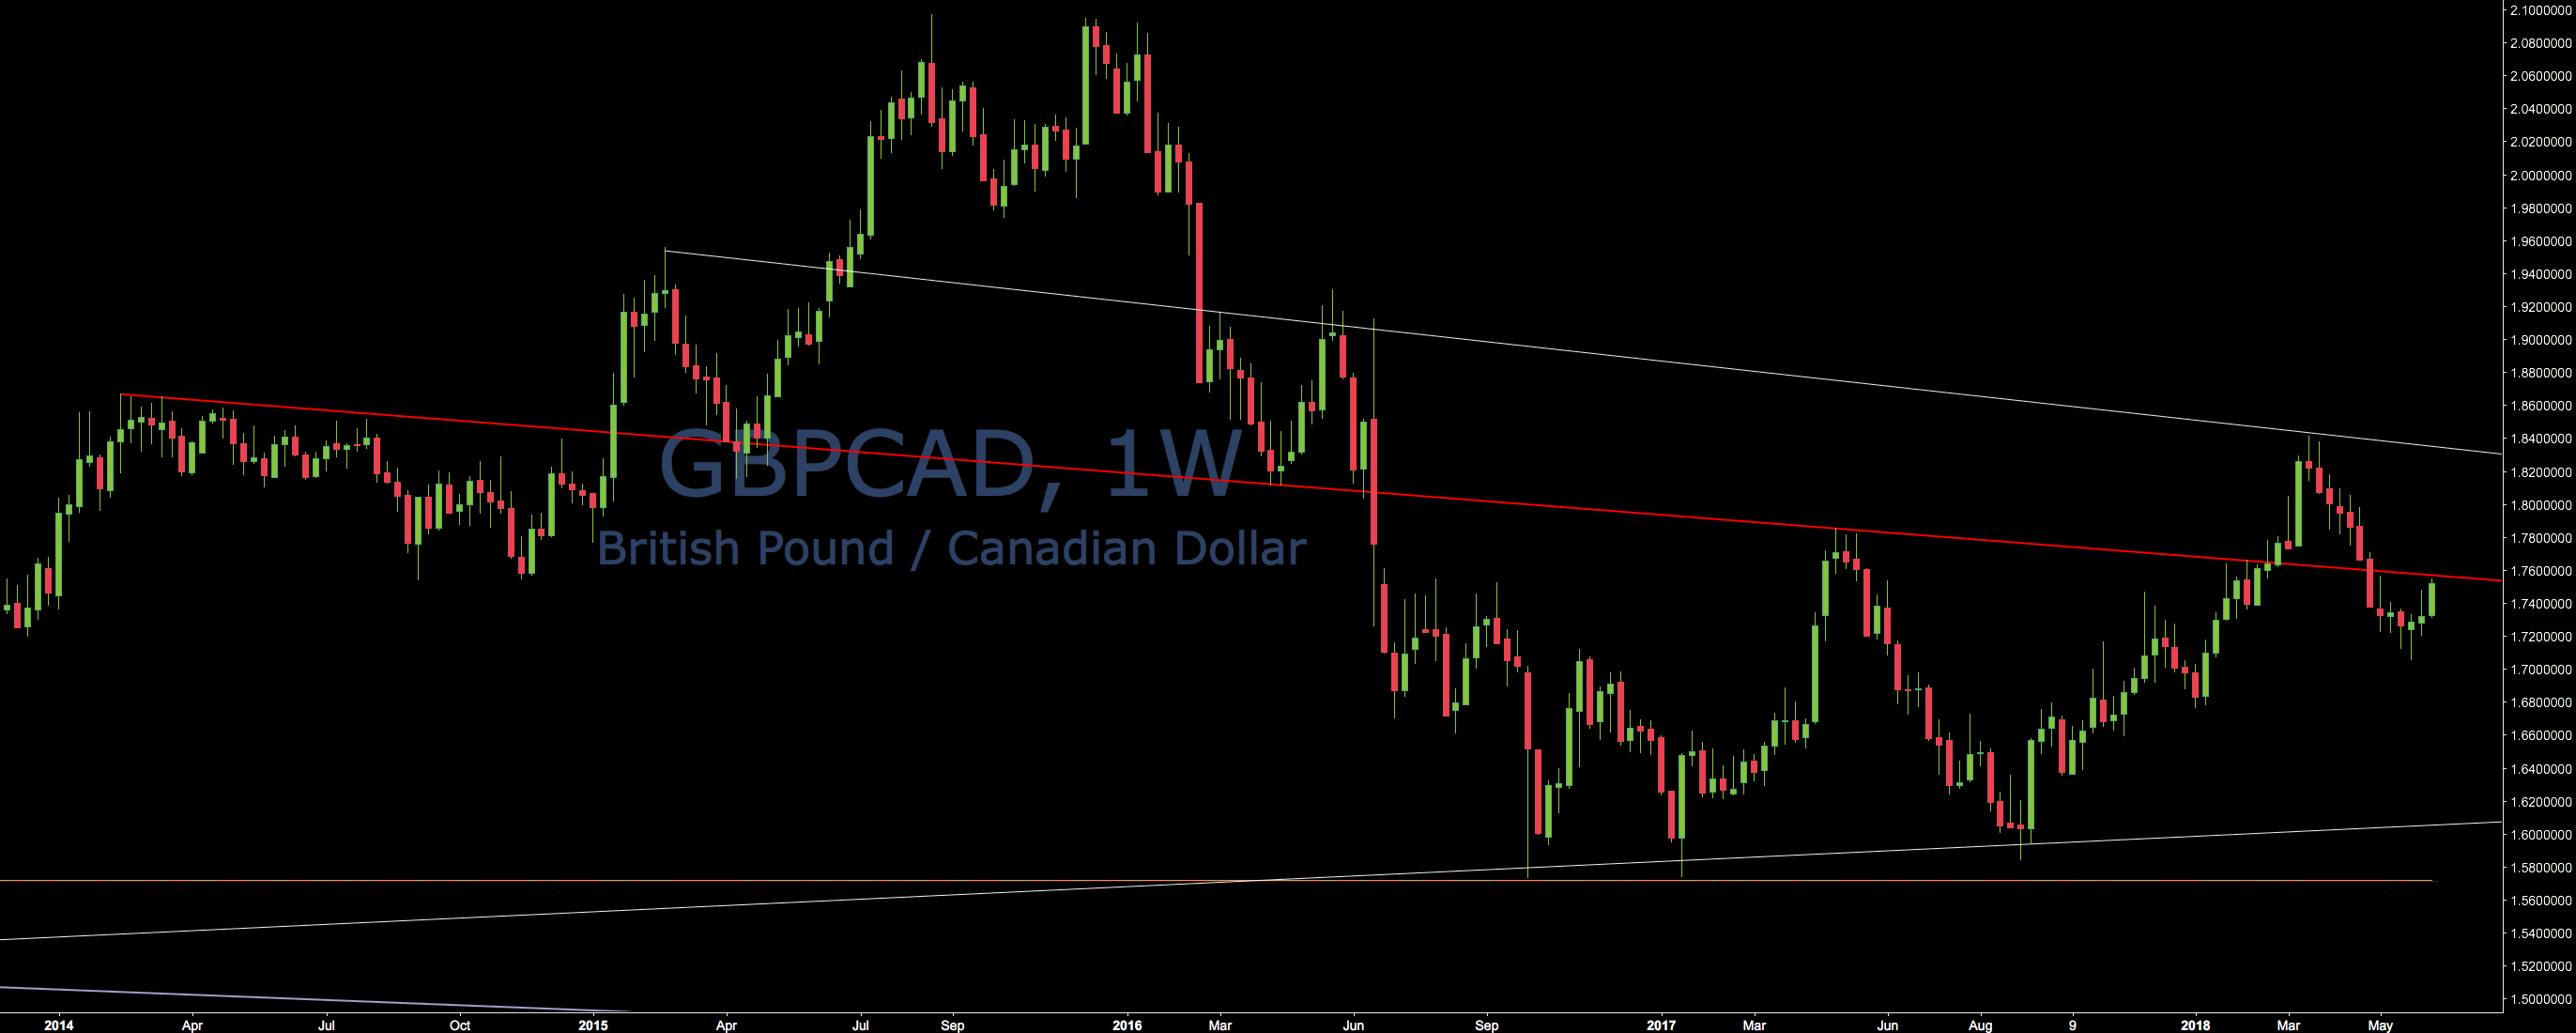
I have already placed a sell-limit for the red trendline.
#GBPHKD
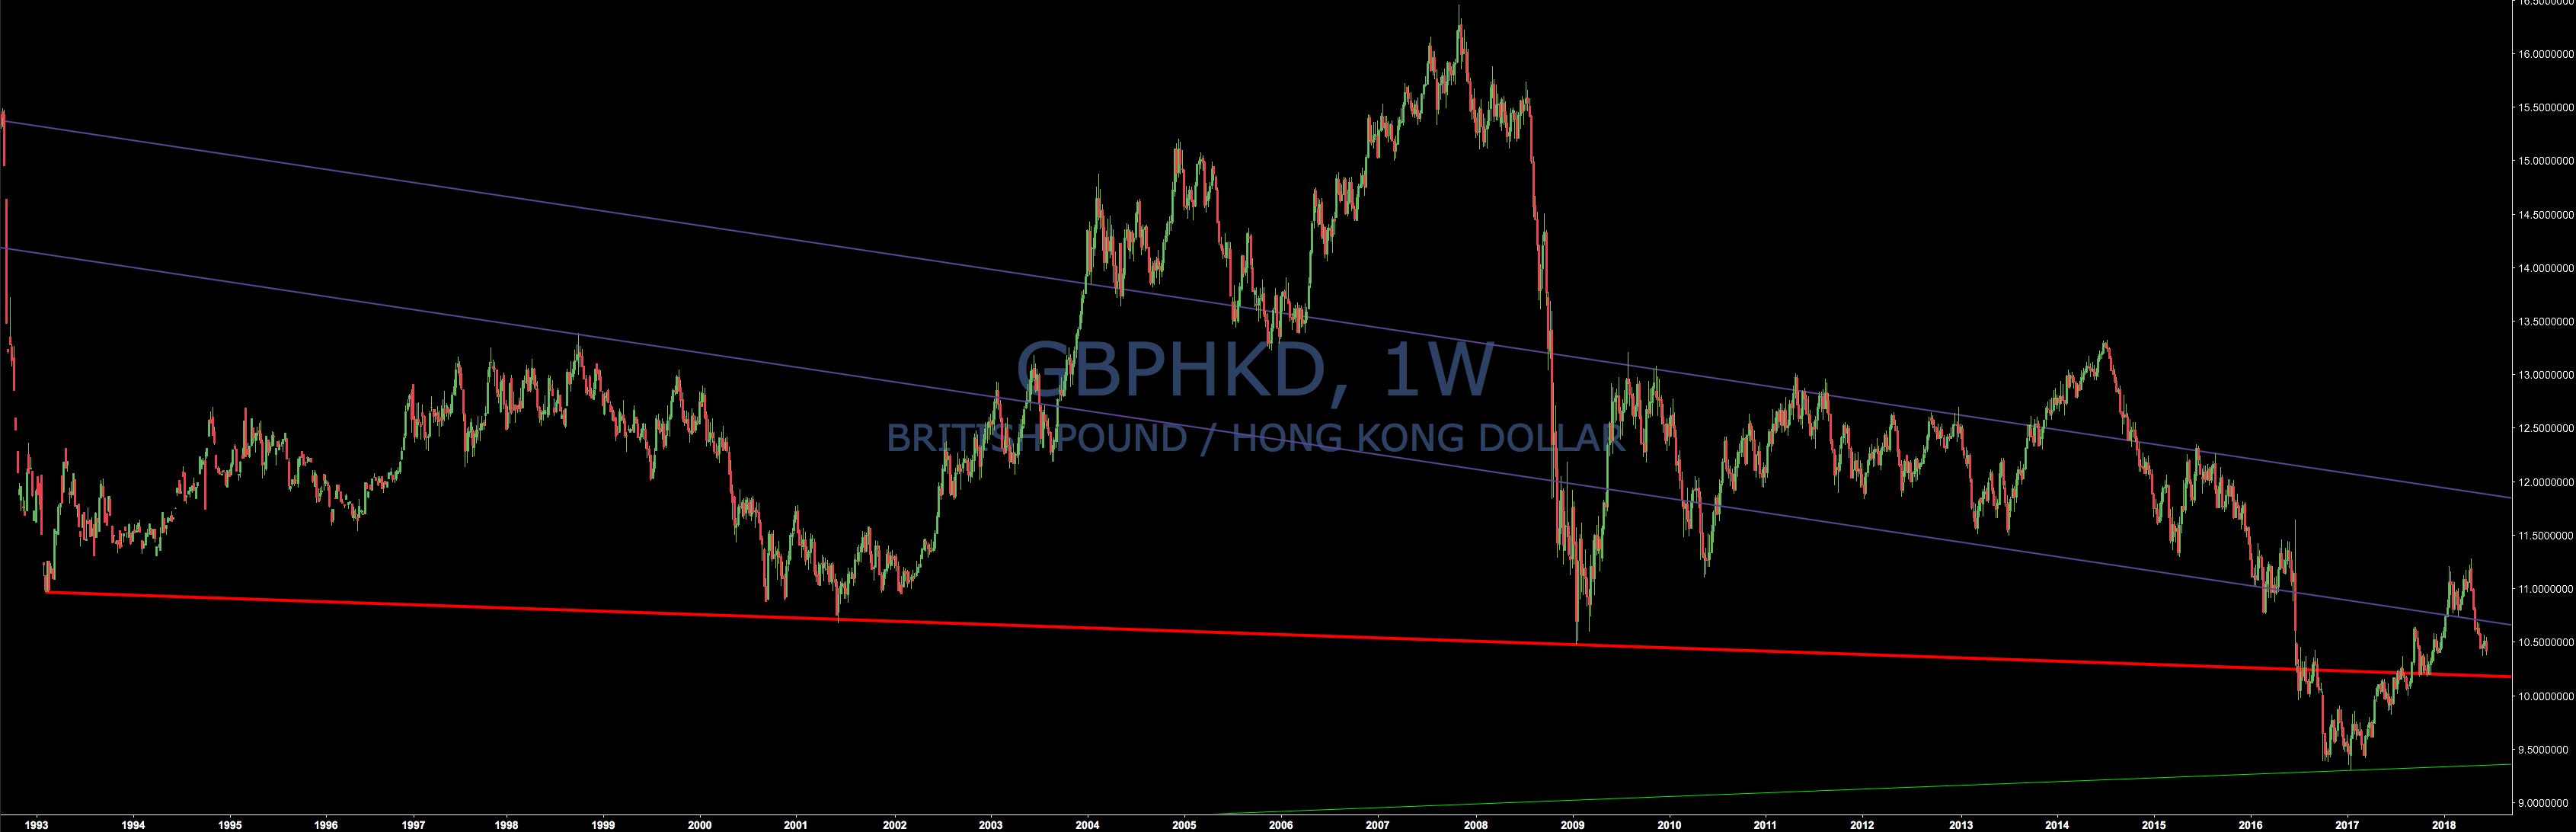
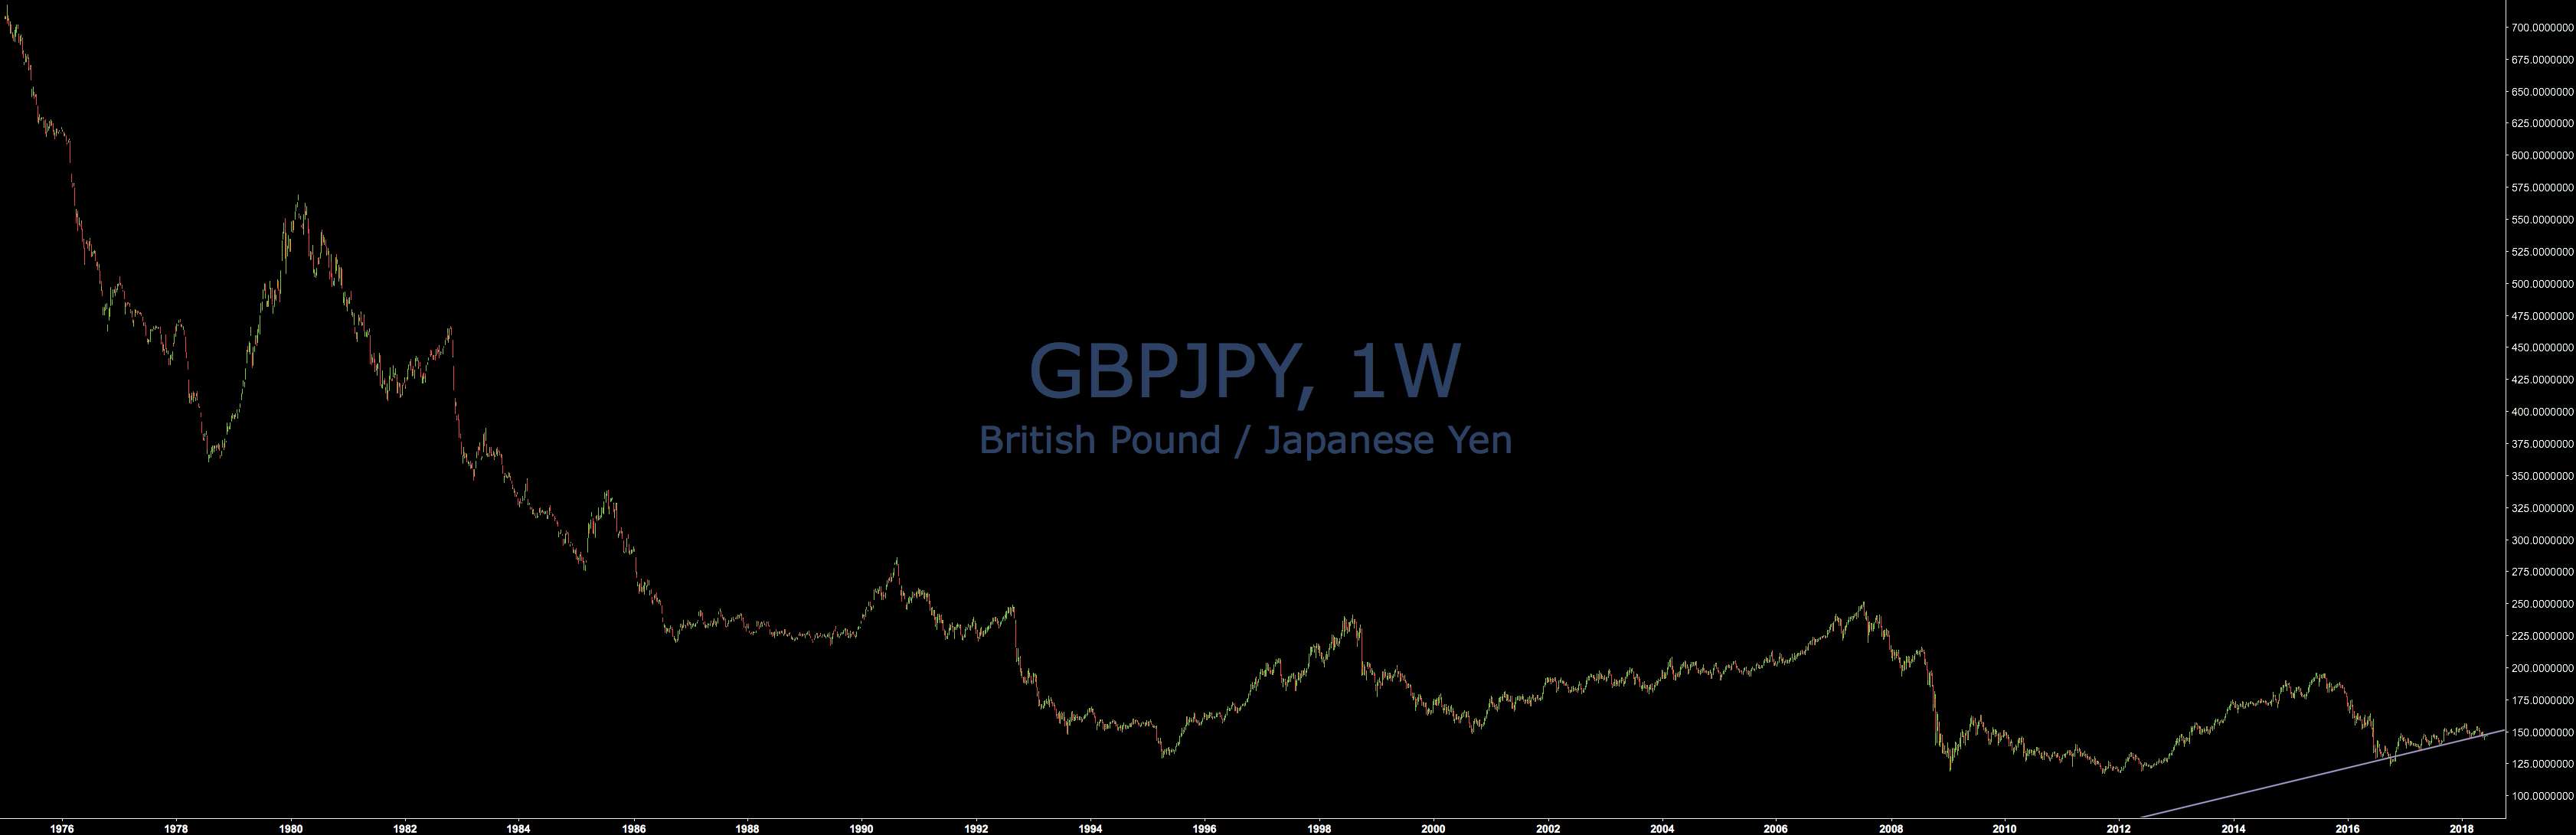
I buy-limited the red trendline. Looks really nice. I think GBP oversold because of this 👇 'U' shaped chart.
#GBPJPY
#GBPUSD

Looks similar to GBPHKD but not so nice.
#GBPZAR

I want to sell stop. But ZAR usually too volatile.
#USDJPY
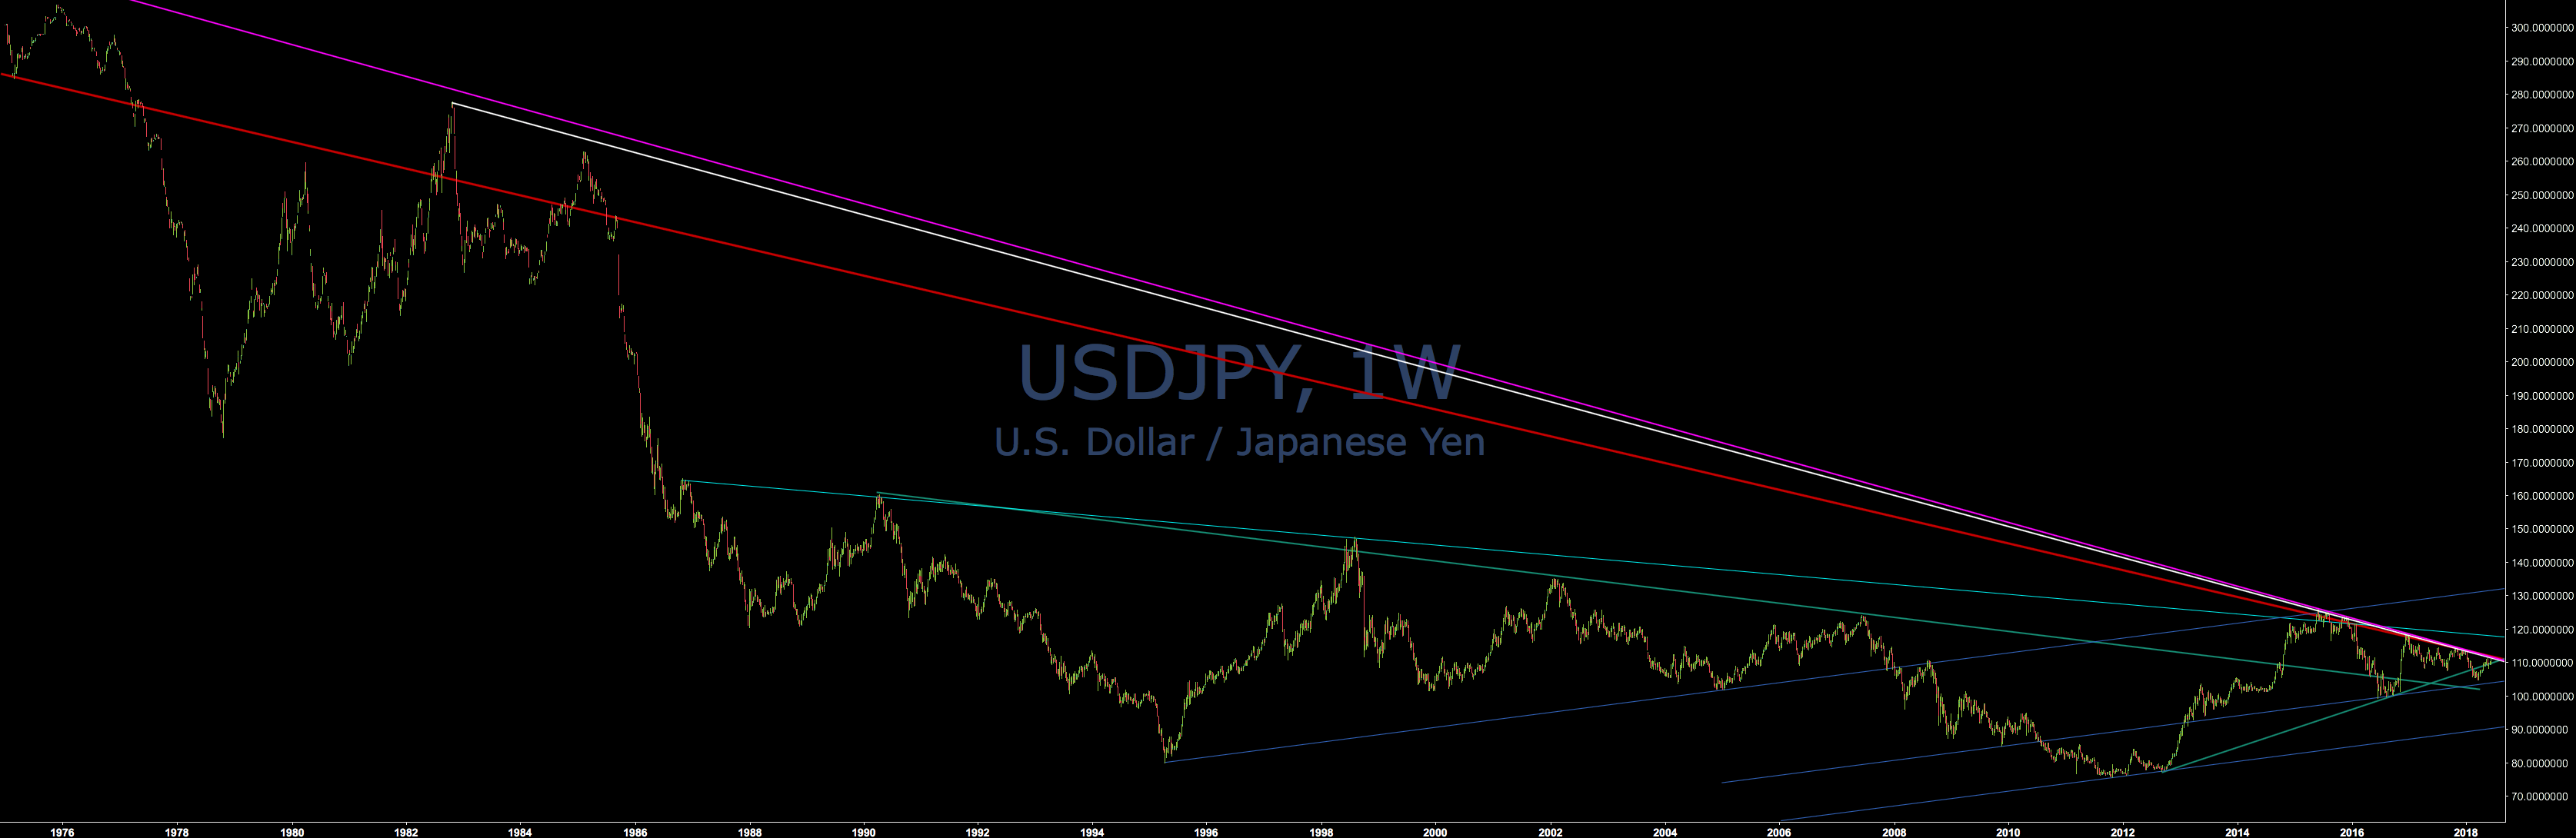
I like this because of this pink trendline from log. scale:

#USDRUB
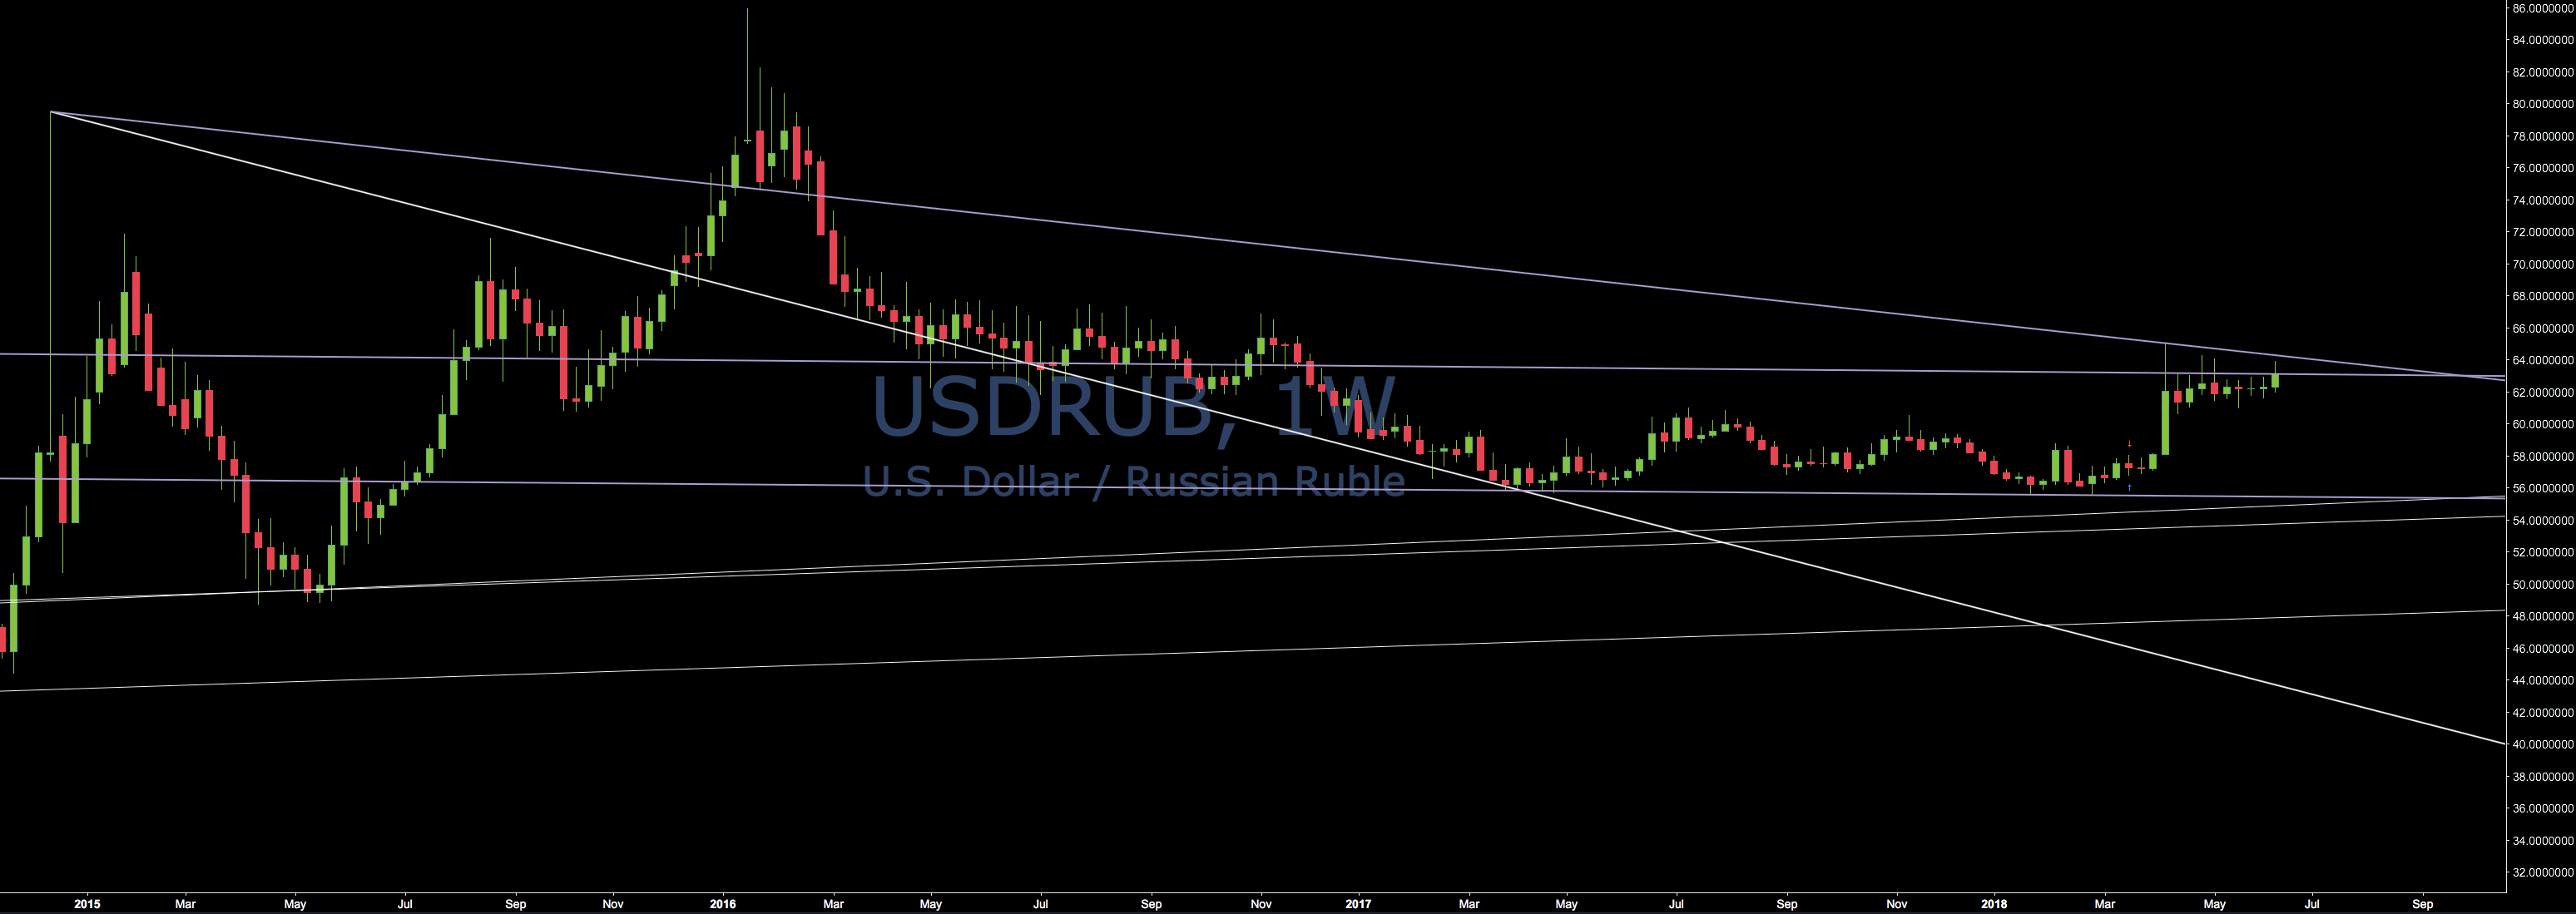
I think USDRUB too high but too volatile too.
#USDZAR
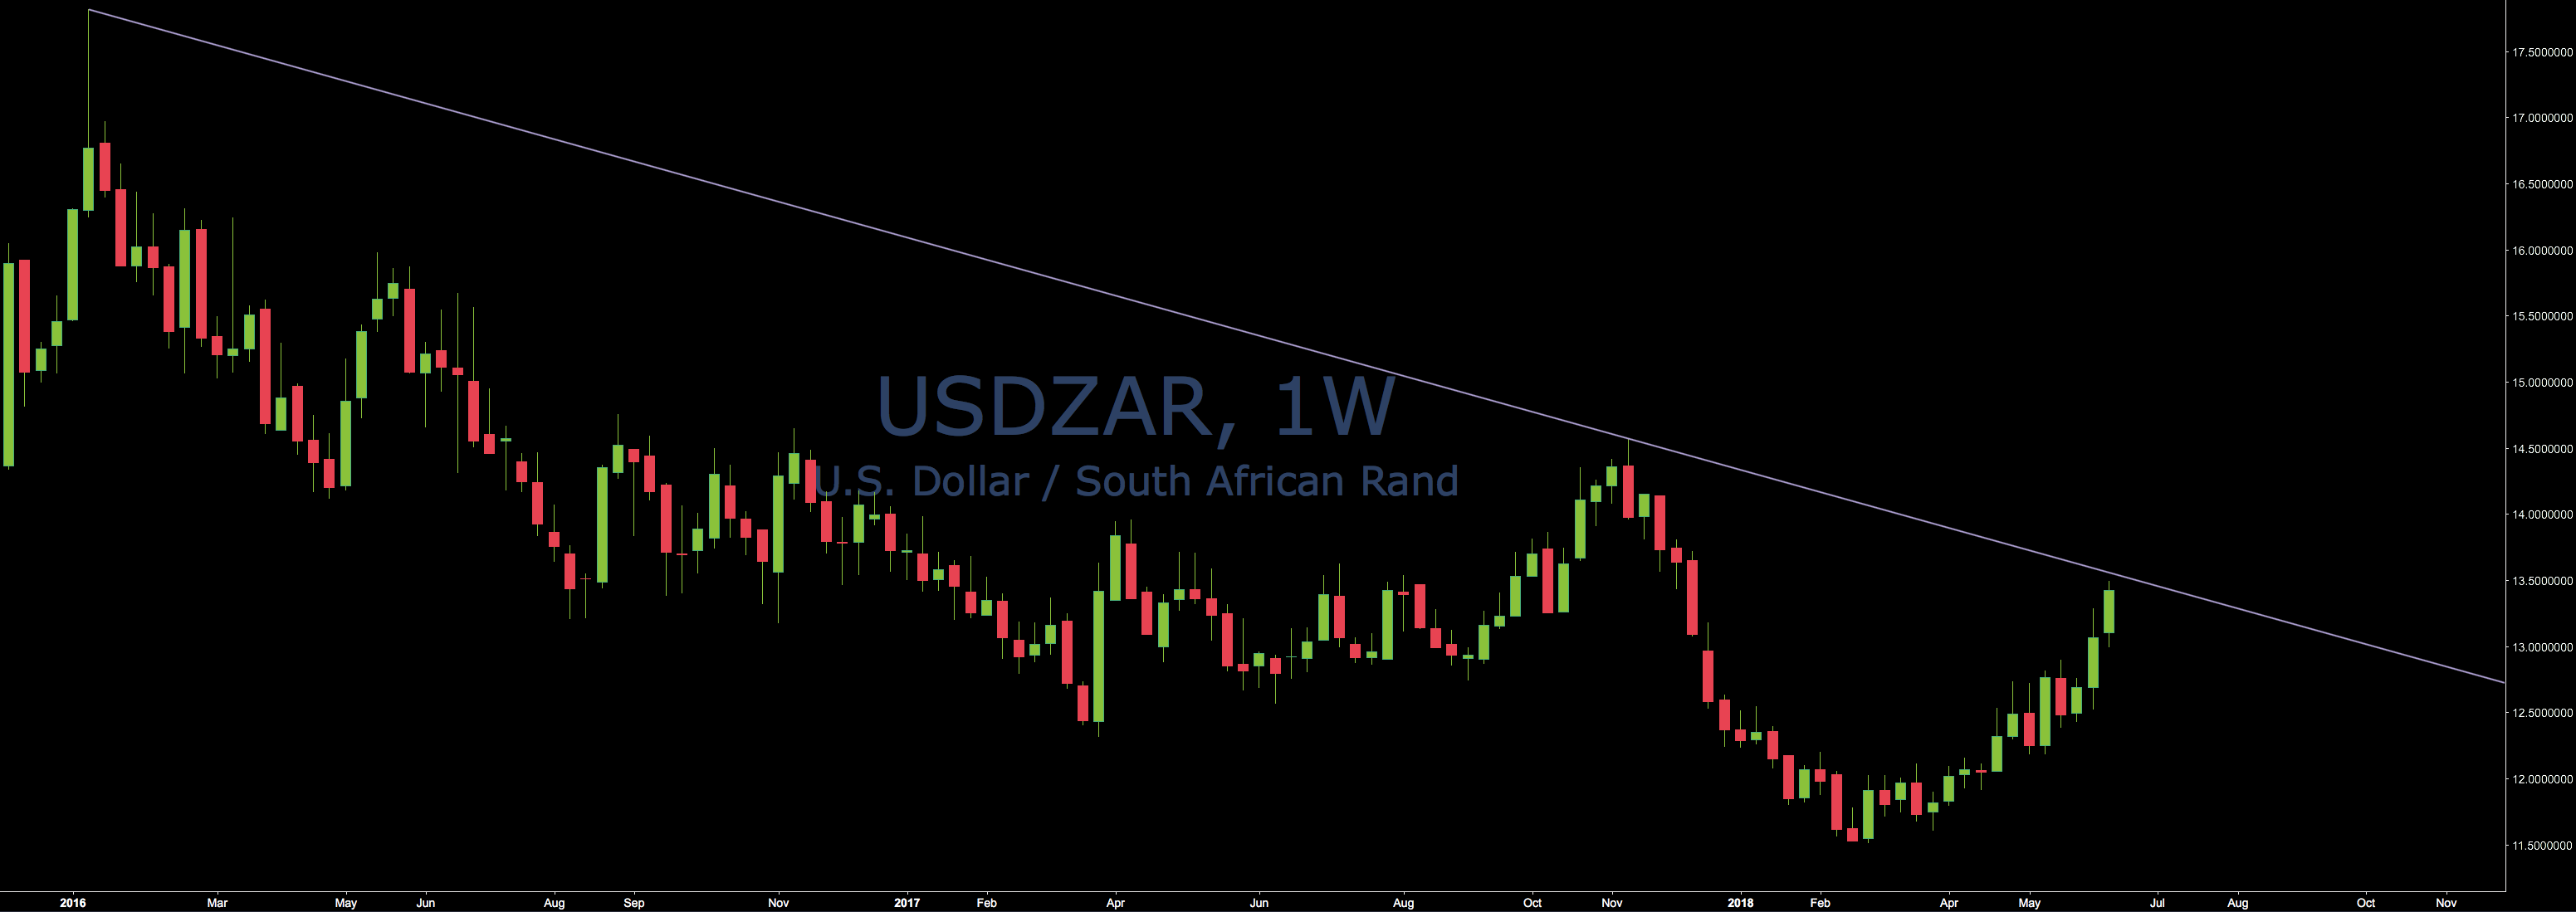
I already placed a sell-limit
#XAGUSD
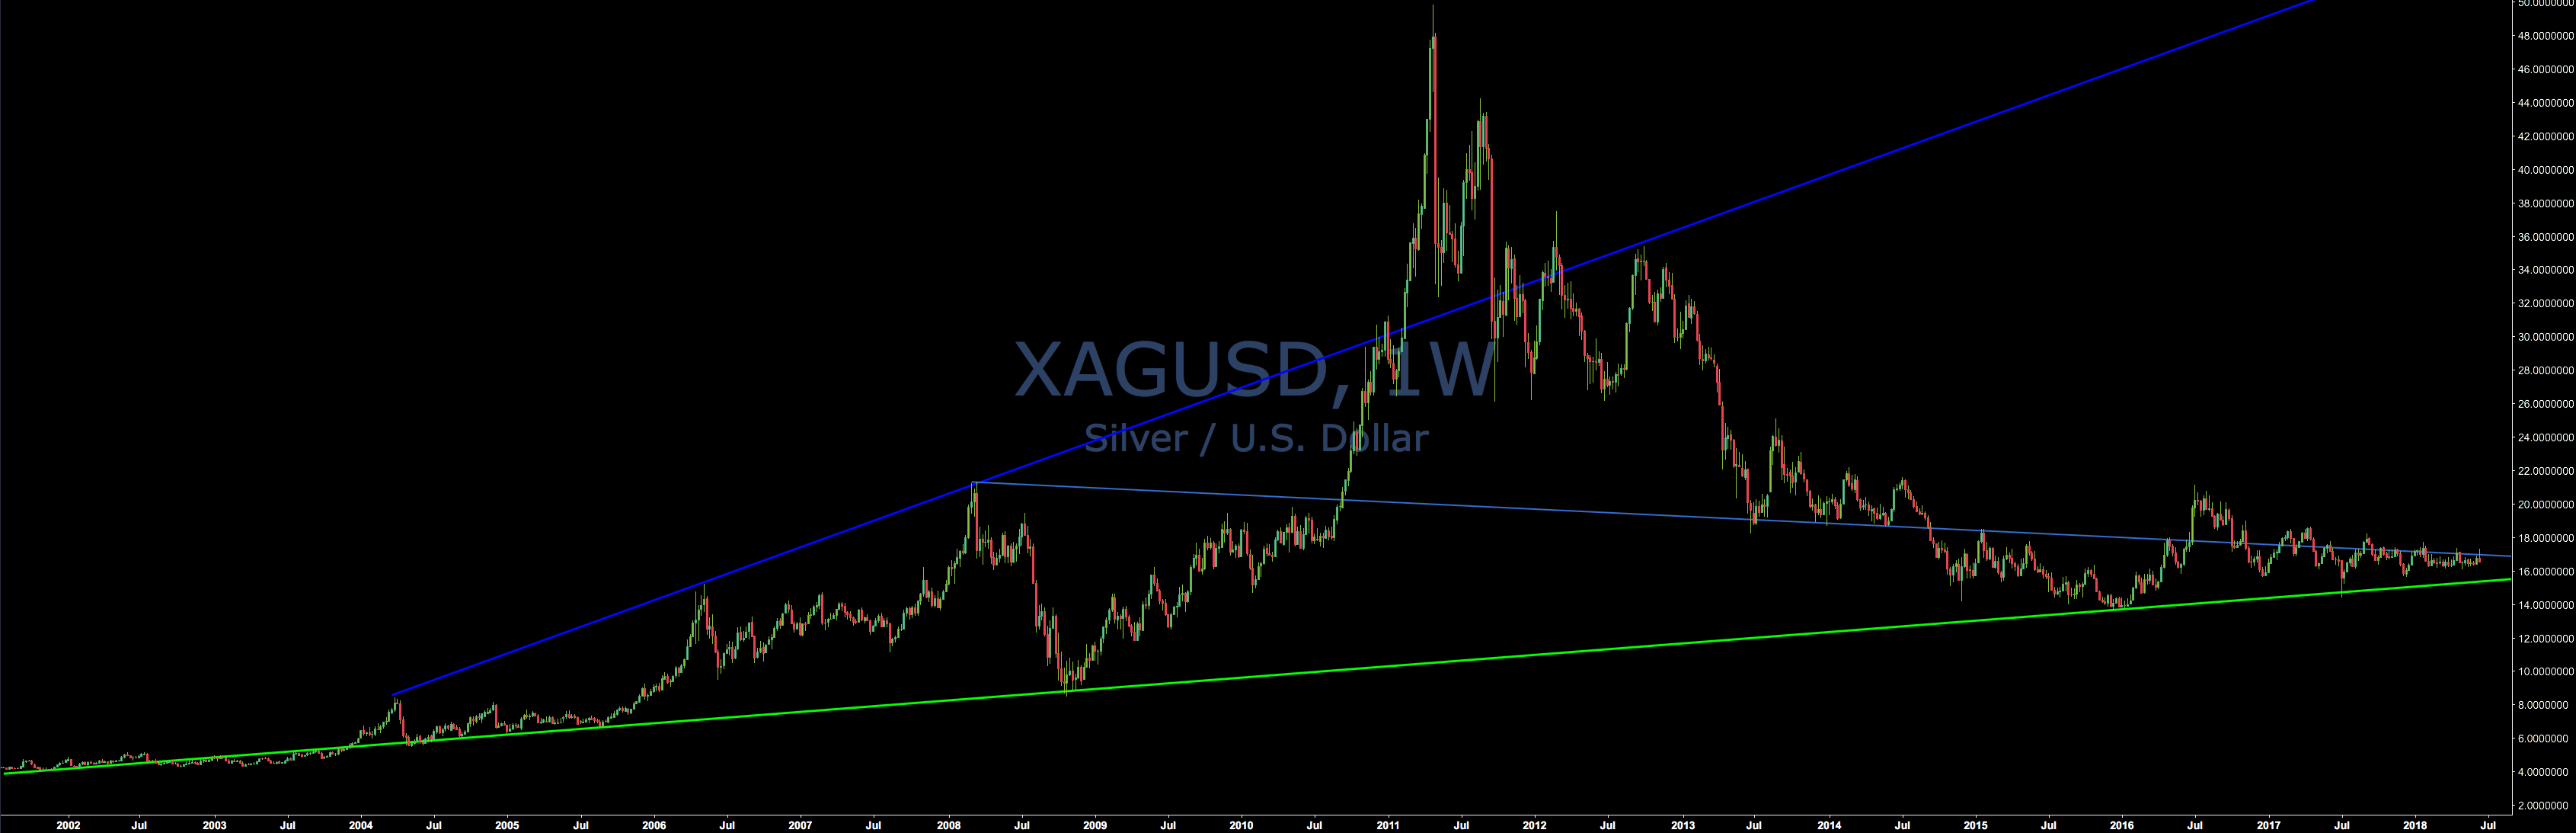
I am going to buy a ton of silver when it approaches the bottom trendline.
Calendar
Thu:
Conclusion
So many trades on GBP can I get some help with choosing the right one in the comment section below?
Risk disclosure: Not a trading advice.
Sources: tradingview.com, systematic thinking