Daily Forex Analysis :
Currency : EUR/USD
As you can see from the below chart after breaking up the triangle formation, I traced the fibonnaci retracement levels as it is starting to bounce back.
So after touching at 1.21979 at the lowest point, it bounced back to rebound and touch the 23.6% Fib level at 1.22335 if it crosses it than you can see price rising upto the 38.2% fib level, and a price lowering after it.
If it bounced back before the 23.6% fib level than it will go below the original lowest of 1.21979
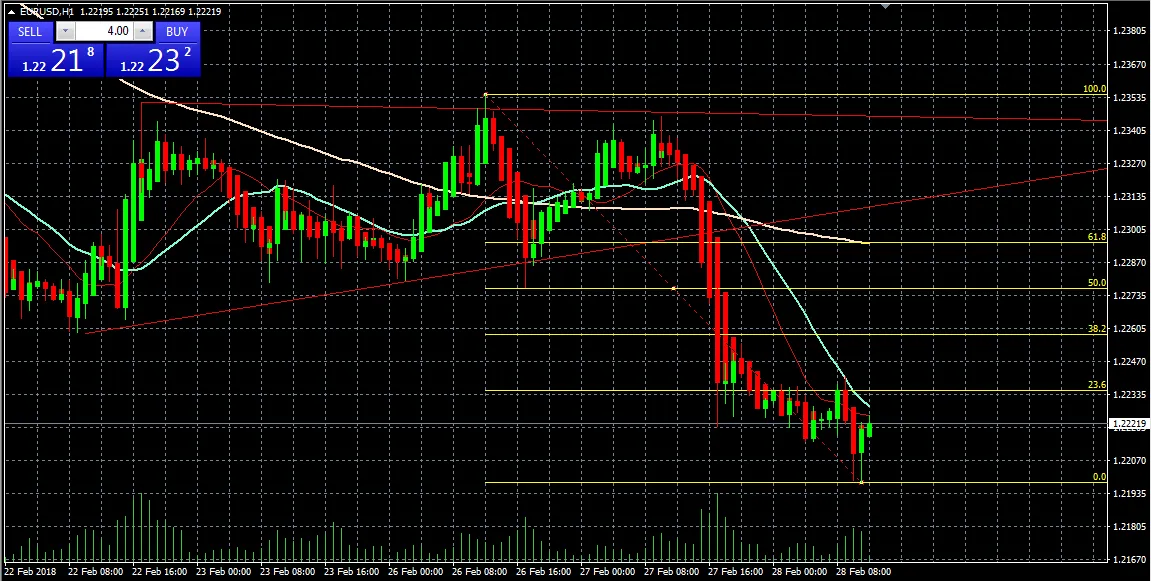
Chart details :-
Candlesticks : Hekien Ashi
Time frame : H1
MA : 14 , 20 , 100