Hive logo source: https://hive.io/
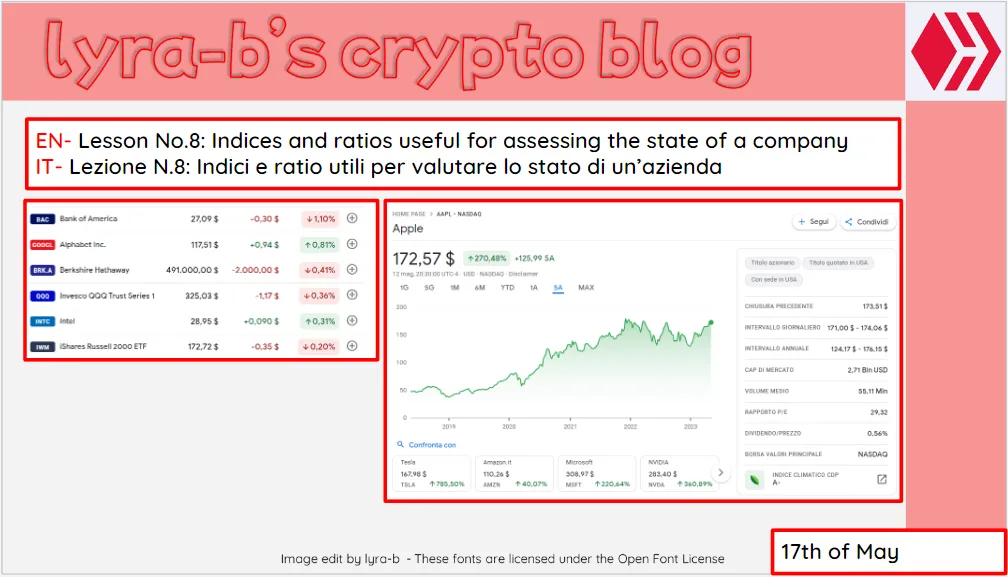
Central image source: https://www.google.com/finance/?hl=it; https://www.google.com/finance/quote/AAPL:NASDAQ?hl=it&window=5Y
English version
Introduction:
I want to share with you from LeoFinance some important insights I am getting about the world of economics and finance.
Disclaimer: I am not a financial advisor, so what is written in this post is a personal opinion, not financial advice. If you want to invest, you must do so knowingly and on your own responsibility.
Lesson No. 8
Company-Shareholder Relationship
The relationship between company and shareholder is based on two factors:
- giving money
- dividends
- buybacks
2.taking money
- dilution
- recapitalisation
- non-transparent sale
Indices and ratios to evaluate companies
These are generic indices that are good for all companies. Ratios starting with "p" indicate a price.
Price - Earning
P/E = price (i.e. cap) / earnings
= cap / earnings
referring to the previous year
Price is the capitalisation of the company, i.e. how much the company costs. Earning is the profit.
P/E ttm
refers to the previous 12 months
P/E forward
refers to a forecast for the next year (like now it is forward to 2023 until 2023 is over. I look at this index for a company that has low growth or high growth, so with large fluctuations, to see how it will perform for the year).
PEG= (P/E) / G
is the price earning relative to growth, so we look at growth and relate it to the P/E.
Ex.1 :
I have a company with a P/E = 20. What is the return on that company?
P/E=20 means that it pays 20 for an earning of 1.
so the return is: E/P=1/20 =0.05 =5%.
Ex.2 :
Company A) P/E= 20
G= 20%
Company B) P/E= 10
G= 10%
PEG=?
Company A) PEG = (S/S) /G = 20/20= 1
Company B) PEG = (P/E) /G = 10/10= 1
PEG is the same, potential is the same
NOTE:
if PEG ≤ 1 profitable company
if 2 < PEG ≤ 1 company good
if PEG > 2 company to be evaluated
Price - Sales
P/S = price/turnover
ratio between company price and turnover
Price - Book
P/B = price/equity of the company
Earning per shares
EPS = earnings/no. of shares
I divide the company's earnings by the total number of shares
P/E = 1 share / EPS
Demonstration:
cap=1 share * no. shares => no. shares= cap/ 1 share
P/E=cap/earnings =
=cap/(EPSn°shares) = cap/(EPS(cap/1 share) = 1 share/EPS
Indices indicating how the company uses the money from the initial capital and how it will return to the shareholders (i.e. how 'good' the company is at managing its capital, its money)
Return to Equity
ROE: the capital money put in by the shareholders
Return on Investment
ROI: how much return on investment the company makes - how good the company is at managing its money.
Look at PE and ROI to understand where to invest in companies. It is not easy to choose and understand which companies to invest in.
The first thing to look at is the balance sheet and then the progression of turnover and profit, see the growth and relate it.
*Indexes concerning the company's dividends.
Payout: actual dividend expressed in money [$].
Payout ratio= payout/EPS
Yeld= payout/price 1 share.
E.g.: if Yield=3.5% the company gave you 3.5% on the dividend
Companies with growing dividends are dividend companies, i.e. they give you dividends.
Question:
Would you be able to assess the value of a company using these indices?
Versione italiana
Introduzione:
Voglio condividere con voi di LeoFinance alcune nozioni importanti che sto ricevendo riguardo al mondo dell'economia e della finanza.
Disclaimer: Non sono un consulente finanziario, quindi ciò che è scritto in questo post è un'opinione personale, non un consiglio finanziario. Se volete investire dovete farlo consapevolmente e sotto la vostra responsabilità.
Lezione nr.8
Rapporto tra Azienda e Azionista
Il rapporto tra azienda e azionista si basa su due fattori:
- dare soldi
- dividendi
- buyback
2.prendere soldi
- diluizione
- ricapitalizzazione
- vendita non trasparente
Indici e ratio per valutare le aziende
Sono indici generici che vanno bene per tutte le aziende. Gli indici che iniziano per “p” indicano un prezzo.
Price - Earning
P/E = prezzo (cioè cap) / guadagno
= cap / utile
riferito all’anno precedente
Il prezzo è la capitalizzazione dell’azienda, ovvero quanto costa l’azienda. Il guadagno è l’utile.
P/E ttm
si riferisce ai 12 mesi antecedenti
P/E forward
è riferito a una previsione per il prossimo anno (tipo ora è forward per il 2023 fino a quando il 2023 non è finito. Guardo questo indice per un’azienda che ha bassa crescita o alta crescita, quindi con forti oscillazioni, per vedere come sarà l’andamento per l’anno).
PEG= (P/E) / G
è il price earning riferito alla crescita, quindi guardiamo la crescita e la correliamo al P/E.
Es.1 :
Ho un’azienda con un P/E = 20. Qual è il rendimento di tale azienda?
P/E=20 significa che paga 20 per avere un guadagno di 1.
quindi il rendimento è: E/P=1/20 =0.05 =5%
Es.2 :
Azienda A) P/E= 20
G= 20%
Azienda B) P/E= 10
G= 10%
PEG=?
Azienda A) PEG = (P/E) /G = 20/20= 1
Azienda B) PEG = (P/E) /G = 10/10= 1
Il PEG è uguale, la potenzialità è la stessa
NOTA:
se PEG ≤ 1 azienda conveniente
se 2 < PEG ≤ 1 azienda buona
se PEG > 2 azienda da valutare
Price - Sales
P/S = prezzo/fatturato
rapporto tra il prezzo dell’azienda e il fatturato
Price - Book
P/B = prezzo/patrimonio netto dell’azienda
Earning per shares
EPS= utile/n° di azioni
divido l’utile dell’azienda per il totale delle azioni
P/E = 1 azione / EPS
Dimostrazione:
cap=1 azione * n° azioni => n° azioni= cap/ 1 azione
P/E=cap/utile =
=cap/(EPSn°azioni) = cap/(EPS(cap/1 azione) = 1 azione/EPS
Indici che indicano come l’azienda utilizza i soldi del capitale iniziale e come essi torneranno indietro agli azionisti (cioè quanto è “brava” l’azienda a gestire il proprio capitale, i propri soldi)
Return to Equity
ROE: i soldi di capitale sociale che ci hanno messo gli azionisti
Return on Investment
ROI: quanto ritorna degli investimenti che vengono effettuati dall’azienda - quanto l’azienda è brava a gestire i propri soldi.
Guardare il PE e il ROI per capire dove investire nelle aziende. Non è facile scegliere e capire in che aziende investire.
Prima cosa da guardare è il bilancio e poi la progressione del fatturato e la progressione degli utili, vedere la crescita e rapportarla.
Indici che riguardano i dividendi dell’azienda.
Payout: dividendo vero e proprio espresso in soldi [$]
Payout ratio= payout/EPS
Yeld= payout/prezzo 1 azione
Es.: se lo Yeld=3.5% l’azienda ti ha dato il 3.5% sul dividendo
Aziende con dividendi in crescita sono azienda da dividendi, cioè che ti danno dividendi.
Domanda:
Sareste in grado di valutare il valore di un'azienda utilizzando questi indici?