The purpose of this analysis is to explore the EURGBP using trendlines and other chart patterns to investigate the chart for possible profitable opportunities. Previous annotations are also shown on the chart with a complex inverted Head and shoulder pattern forming in the EURGBP between April 08, 2017 and April 27, 2017.
A complex head and shoulders because more than one left shoulder (LS) and/or right shoulder (RS) is identified. Confirmation for this bullish pattern (although not 100% of the time) occurred on April 27, 2018 when price closed above the black dotted line at ~0.87694.
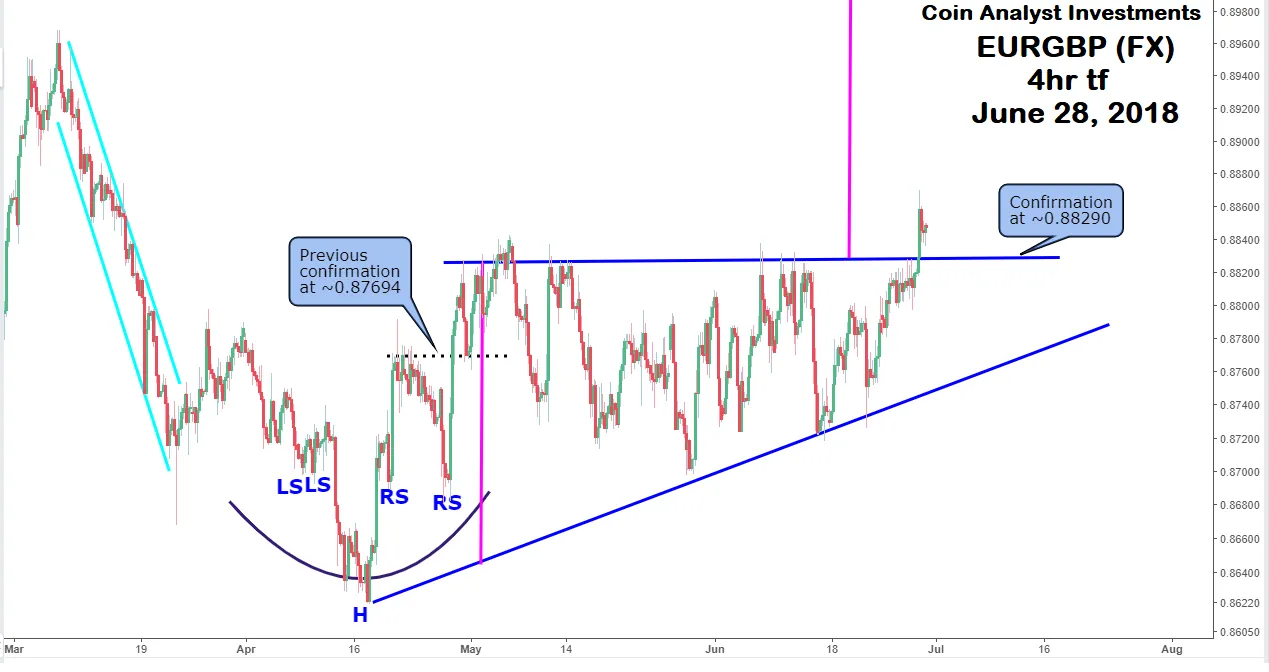
Price open of ~0.86470 that is part of the Head (H) of the previous pattern is also used in this analysis as part of the pivots used to draw the sloping line of the ascending triangle on the chart. An ascending triangle is also ideally a bullish pattern and it is used to capture price action between April 17, 2018 and June 28, 2018 prior to price action breaking out of the chart pattern which means we have a confirmation for the bullish chart pattern.
The vertical pink arrow used inside the ascending triangle is used to indicate the width of the triangle. Likely point to take profit is ~0.90085 which is derived by projecting the width of the chart pattern onto its breakout point. This indicated by the vertical pink line above the triangle.
Join Our Premium Research and analysis group for more information on chart annotations, analysis of the EURGBP and other FX pairs
https://coinanalyst.investments/become-a-member/