Ethereum Price Overview
Ethereum saw a HUGE rally towards the end of December, even having over a 100% increase in price from December 11th-18th, before we saw a minor correction going into the new year. Eventually, the bulls celebrated as price finally reached $1k and broke the structure convincingly. It has been on the rise ever since and below we'll review it's progress starting from the beginning of December.
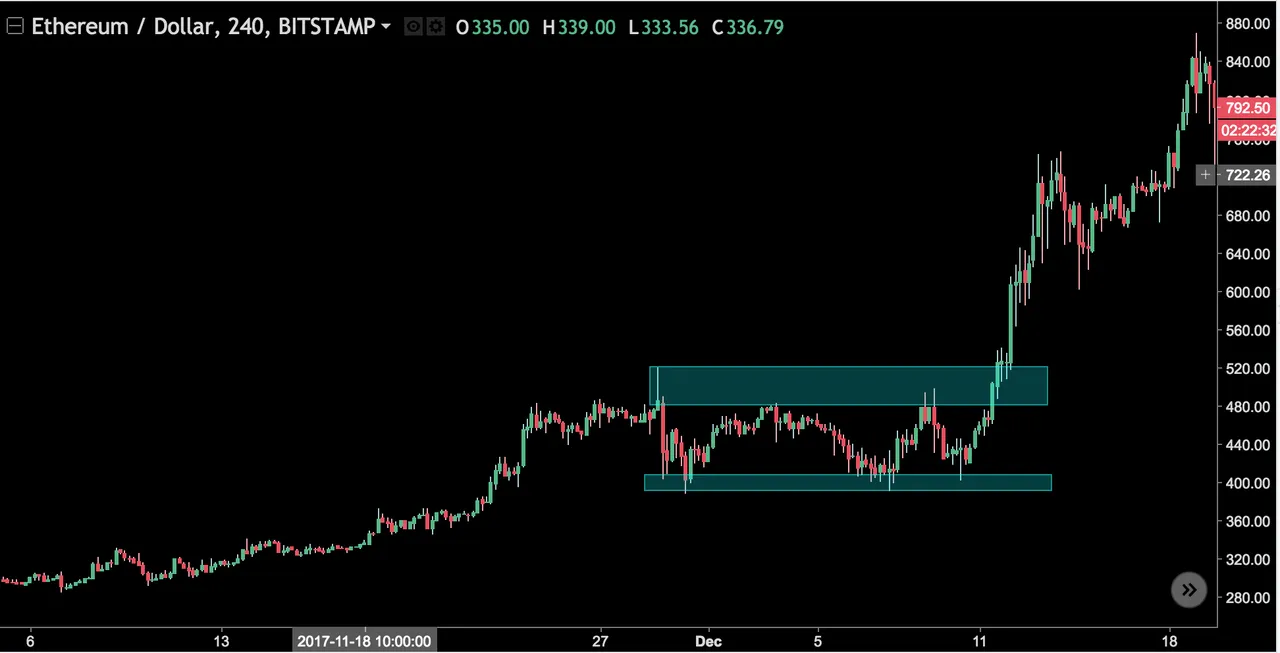
Price Jumps 100% after a Channel Break
Candles were bouncing back and forth within a channel throughout the early days of December, but eventually broke for a rally past the $500 structure to new highs and eventually settling at the $840 price point in Mid December. Christmas has definitely come early for Ethereum investors, however eventually what goes up - must come down.
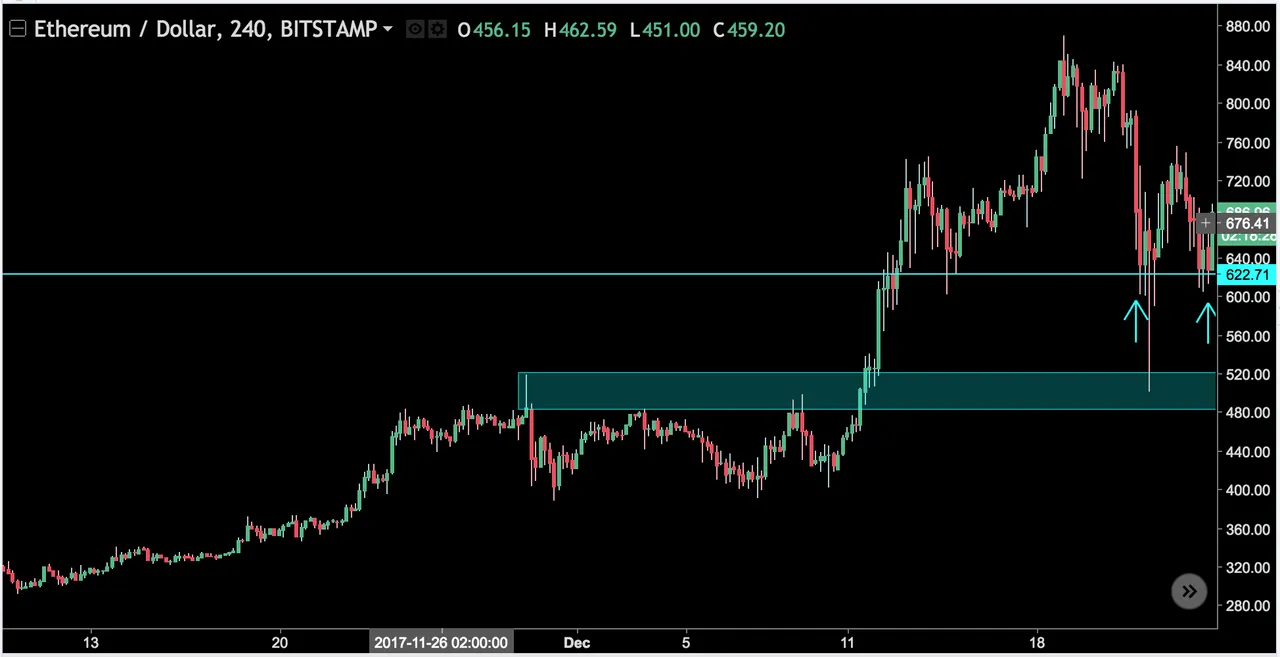
Correction to the prior $500 Structure
We saw price fall significantly almost 80% after a HUGE rally to the previous structural support of the $500 price. However, it seemed to fake out investors who thought there may be a much anticipated immediate crash (this move happened to a variety of coins at the same time) and price eventually settled right at $600. This was an interesting development as the market assumed that the bubble was possibly bursting due to the significant decline in price for almost every major cryptocurrency - however in the end the bulls stayed steady and brought the price back to equilibrium.

Double Bottom Created
Right before Christmas, we saw a very nice, strong double bottom formed after price continuously tried to test the support structure. This created an opportunities for buyers to opt into Ethereum @ around $620 prior to a rally back towards the $800 area.
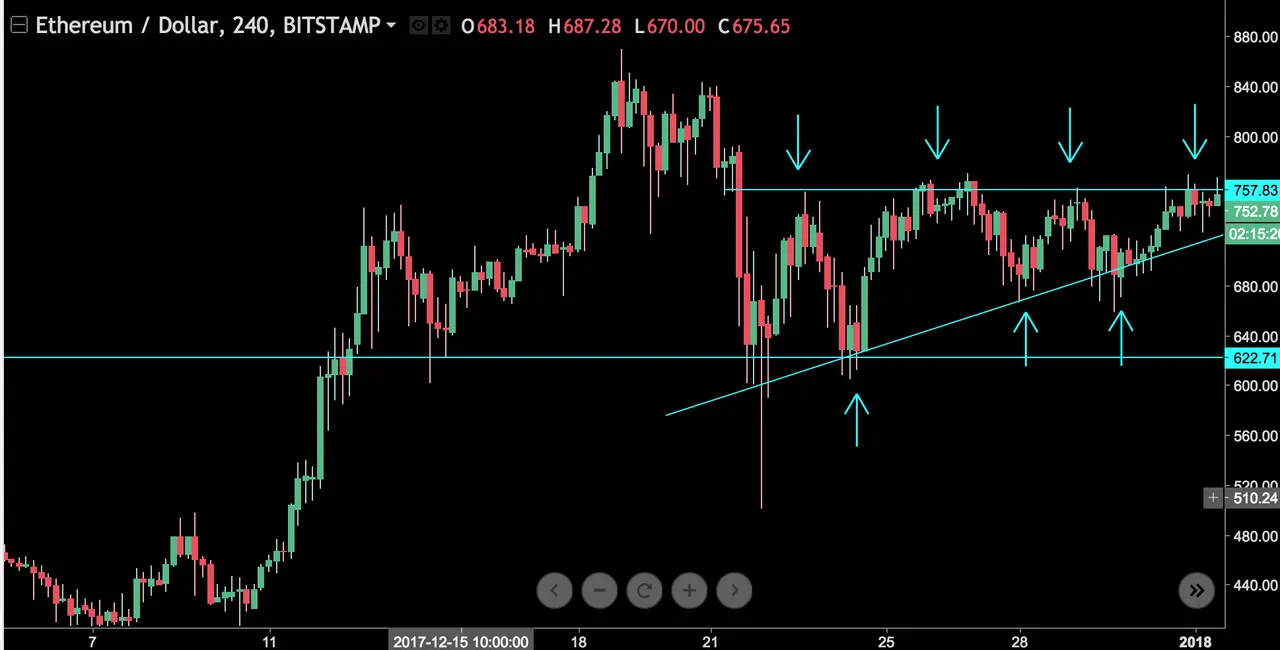
Strong Triangle Formation formed, with a Bullish bias
As we approached the new year, we saw the beginning of an interesting triangle formation with a bullish bias. Price bounced at least 3 times off each trend line, solidifying the formation and giving buyers a potential signal upon the breakout of the triangle.
A Triangle Formation is a Horizontal trend line and a upwards or downwards slanted trend line, where the trajectory meets the Horizontal Trendline for a possible reaction point. Essentially, buyers will begin looking for entry opportunities at the "squeeze", or when price approaches the narrow end of the triangle.
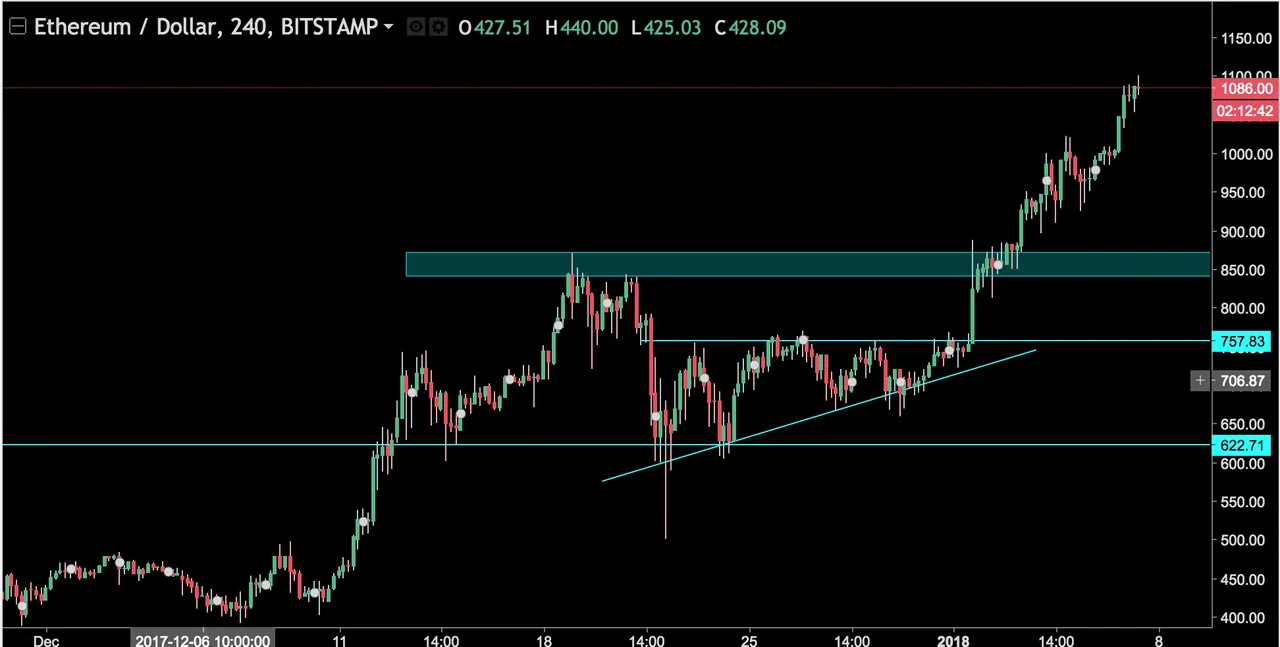
Price breaks Triangle for new highs past previous Supply Zone
And BOOM!!!!! Price BLEW past the prior $840 Supply Zone and ended up making new highs and not even blinking when breaking the $1k mark in the new year. As far as we've seen, price has not stopped it's rally and it has continued to progress towards the $1.1k mark. It's too soon to tell when the next correction will be, but it will be a good bet that price will eventually test the $1k structure area again before the next rally, as it is a major psychological level.
What is next?
It will be a good time for investors to wait and see where the price will eventually correct. Conventional trading wisdom will state that price will gravitate back towards the $1k price structure and then use that as a reaction point for a possible rally to higher highs. Again, when testing trend lines, wait for the close of the candle before the entry, or risk being involved in a fake out & a resulting candle wick.